80th Assembly District
District
Candidates
| Assembly District 80 Candidates on the Primary Ballot | ||
| Incumbent: Mike Bare | ||
Jan 1 thru July 30
|
||
|---|---|---|
| receipts | disbursements | |
| Republican | ||
| Simran Arora | $0.00 | $0.00 |
| Democratic | ||
| Mike Bare | $16,812.00 | $10,512.87 |
| Data from the 2026 July Continuing Report. Any amended reports might not yet be shown. | ||
Past election results
| Election Results in Wisconsin State Assembly District 80 | ||||||
votes
|
Dem. %1 |
margin (Dem. - Rep.)
|
||||
|---|---|---|---|---|---|---|
| total | Dem. | Rep. | votes | points2 | ||
| 2016 President | 31,055 | 20,467 | 8,326 | 71.1% | +12,141 | +42.2 |
| 2016 Senator | 30,889 | 20,317 | 10,067 | 66.9% | +10,250 | +33.7 |
| 2018 Governor | 31,707 | 22,165 | 8,942 | 71.3% | +13,223 | +42.5 |
| 2018 Senator | 31,587 | 23,160 | 8,394 | 73.4% | +14,766 | +46.8 |
| 2020 President | 38,967 | 28,484 | 9,773 | 74.5% | +18,711 | +48.9 |
| 2022 Governor | 35,010 | 26,802 | 7,964 | 77.1% | +18,838 | +54.2 |
| 2022 Senator | 34,928 | 26,022 | 8,820 | 74.7% | +17,202 | +49.4 |
| 2024 President | 42,876 | 31,375 | 10,650 | 74.7% | +20,725 | +49.3 |
| 2024 Senator | 42,639 | 31,136 | 11,003 | 73.9% | +20,133 | +47.8 |
| 2024 WI Assembly | 41,667 | 30,593 | 11,038 | 73.5% | +19,555 | +47.0 |
| 2025 WI Sup. Ct.3 | 34,041 | 27,099 | 6,922 | 79.7% | +20,177 | +59.3 |
| 1 Share of the two-party vote. For Rep. share, subtract from 100. | ||||||
| 2 Dem % of the two-party vote minus Rep % of the two-party vote | ||||||
| 3 Formally nonpartisan candidates assigned party labels based on state endorsements | ||||||
| Election results allocated into 2024 district boundaries based on population overlap. Calculations by John Johnson (johndjohnson.info). | ||||||
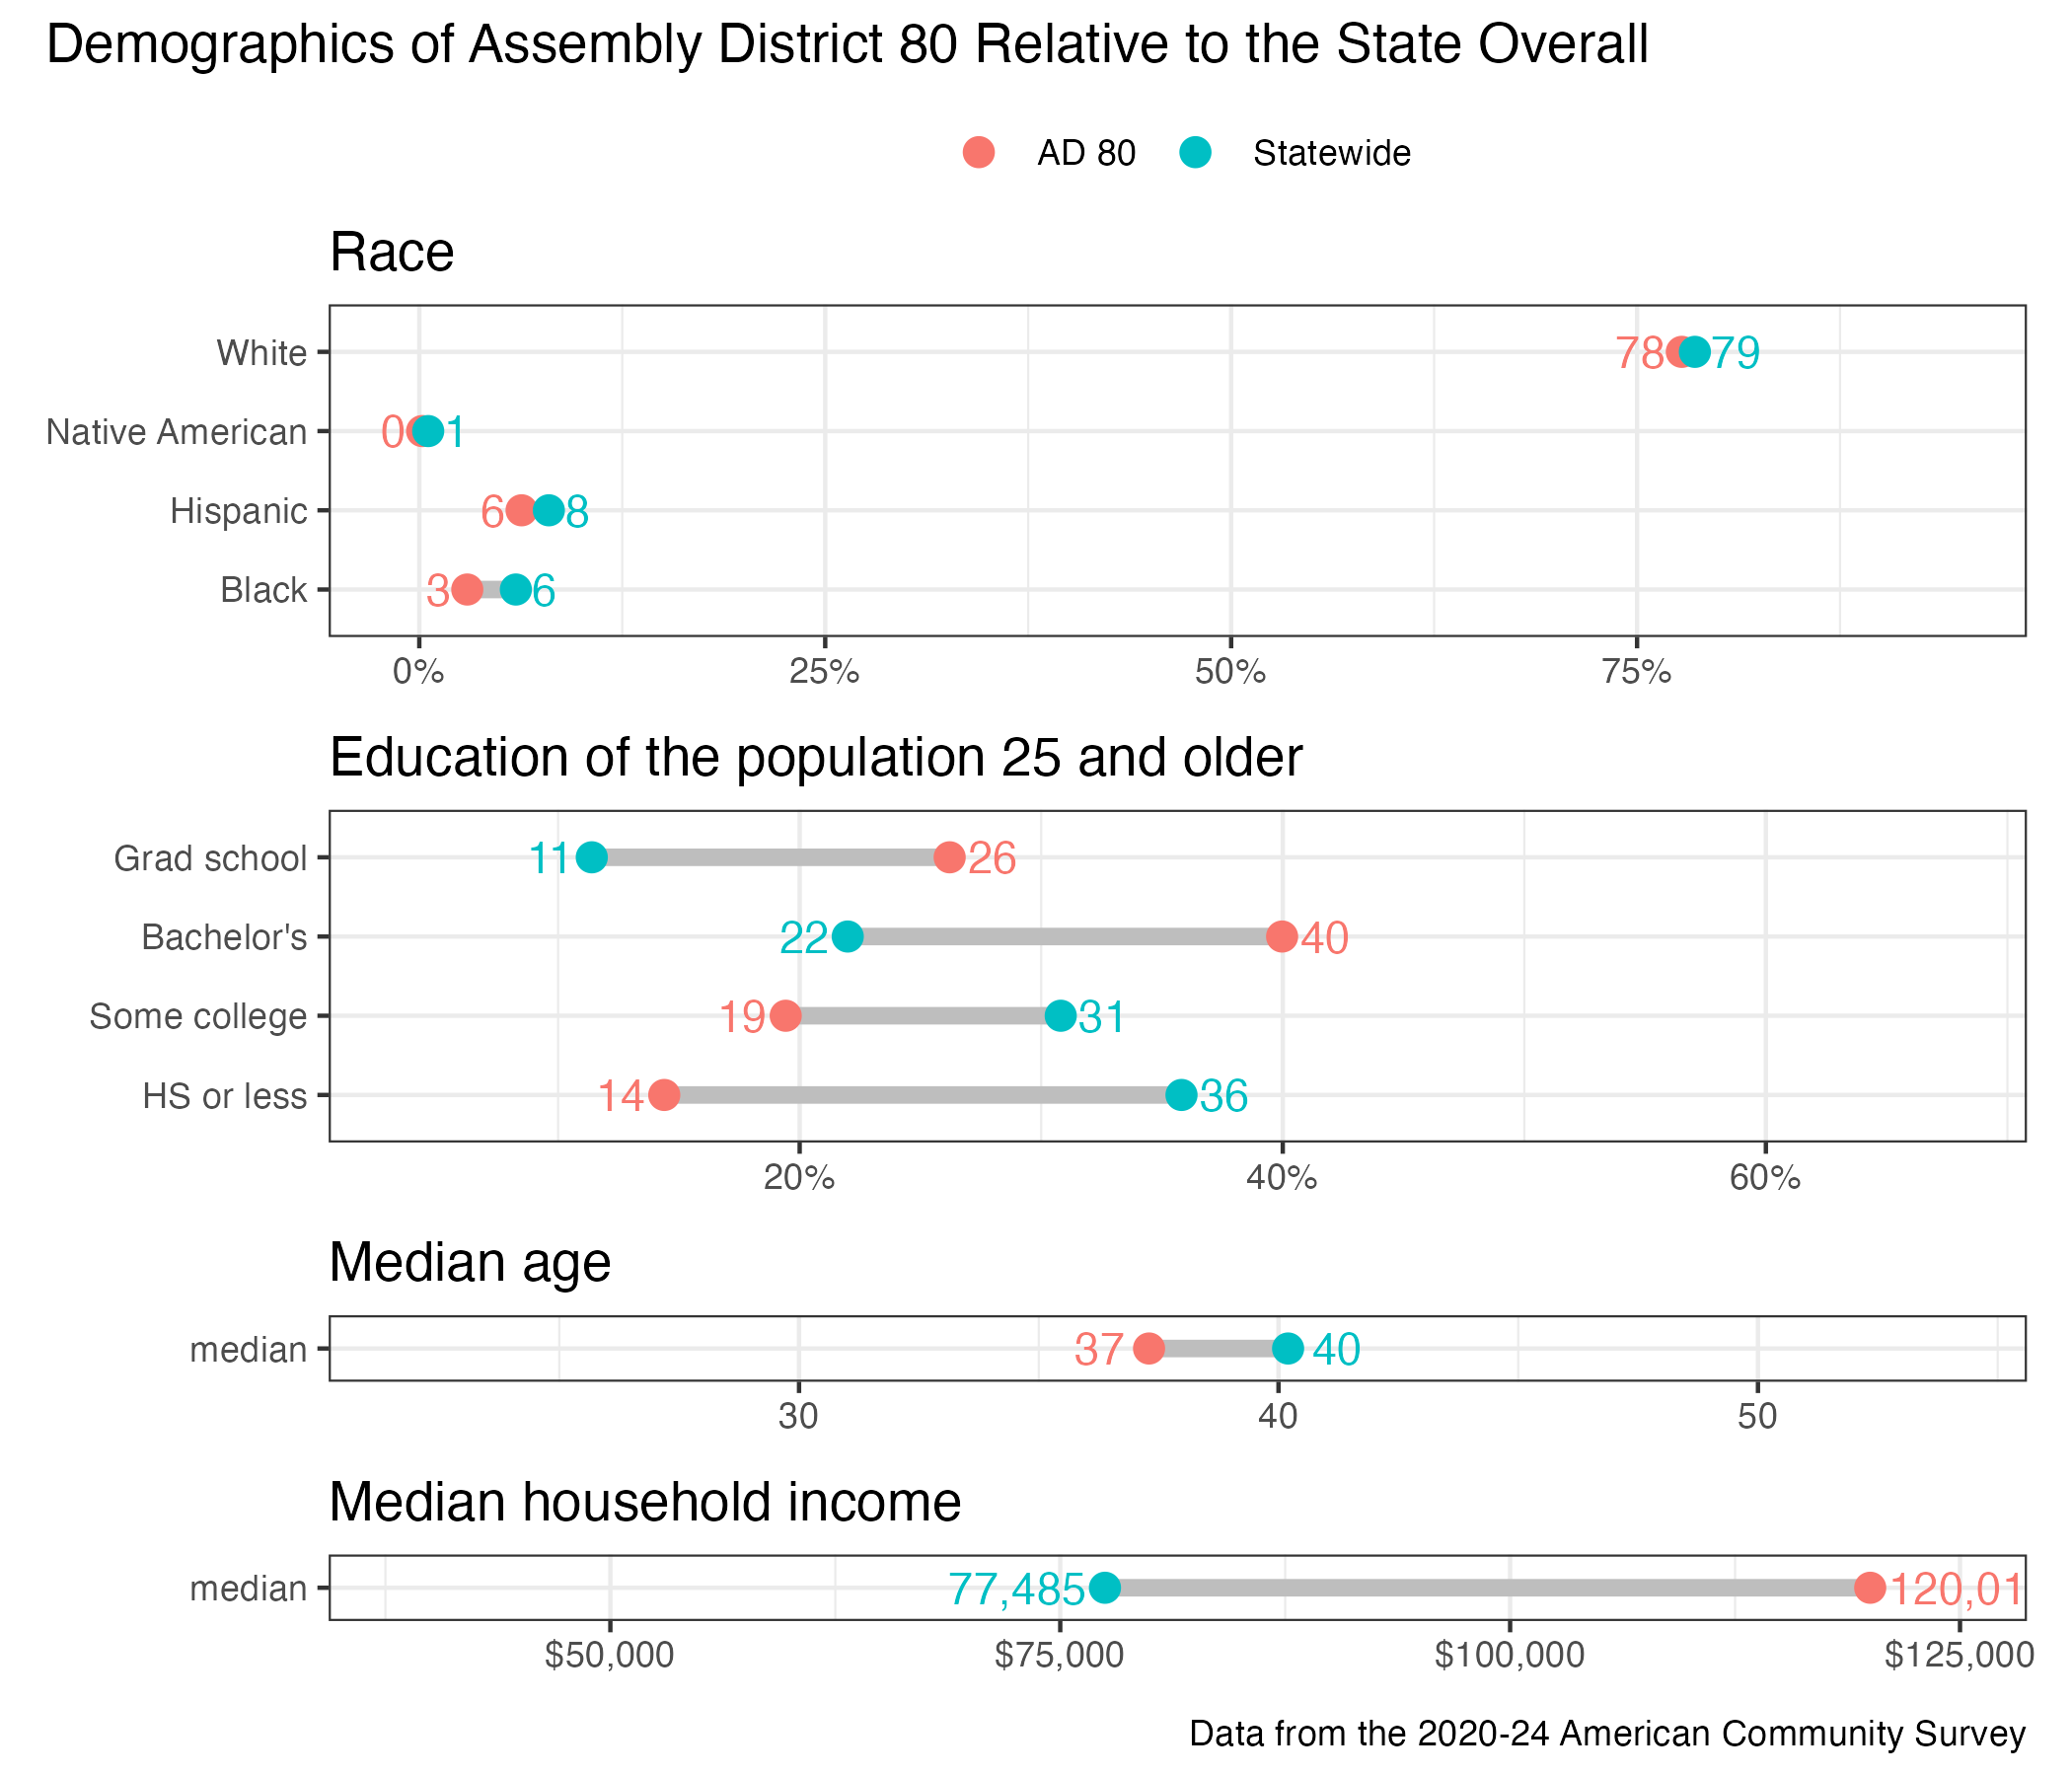
District demographics