90th Assembly District
District
Candidates
| Assembly District 90 Candidates on the Primary Ballot | ||
| Incumbent: Amaad Rivera Wagner | ||
Jan 1 thru July 30
|
||
|---|---|---|
| receipts | disbursements | |
| Republican | ||
| Jessica Henderson | $0.00 | $0.00 |
| Democratic | ||
| Amaad Rivera-Wagner | $8,642.36 | $2,118.77 |
| Data from the 2026 July Continuing Report. Any amended reports might not yet be shown. | ||
Past election results
| Election Results in Wisconsin State Assembly District 90 | ||||||
votes
|
Dem. %1 |
margin (Dem. - Rep.)
|
||||
|---|---|---|---|---|---|---|
| total | Dem. | Rep. | votes | points2 | ||
| 2016 President | 23,118 | 11,554 | 9,840 | 54.0% | +1,714 | +8.0 |
| 2016 Senator | 22,641 | 11,164 | 10,475 | 51.6% | +689 | +3.2 |
| 2018 Governor | 20,297 | 11,075 | 8,647 | 56.2% | +2,428 | +12.3 |
| 2018 Senator | 20,175 | 12,274 | 7,870 | 60.9% | +4,404 | +21.9 |
| 2020 President | 24,500 | 13,419 | 10,560 | 56.0% | +2,859 | +11.9 |
| 2022 Governor | 18,500 | 10,454 | 7,818 | 57.2% | +2,636 | +14.4 |
| 2022 Senator | 18,440 | 10,122 | 8,269 | 55.0% | +1,853 | +10.1 |
| 2024 President | 24,994 | 13,526 | 11,023 | 55.1% | +2,503 | +10.2 |
| 2024 Senator | 24,640 | 13,486 | 10,484 | 56.3% | +3,002 | +12.5 |
| 2024 WI Assembly | 23,693 | 12,446 | 11,222 | 52.6% | +1,224 | +5.2 |
| 2025 WI Sup. Ct.3 | 16,027 | 9,846 | 6,165 | 61.5% | +3,681 | +23.0 |
| 1 Share of the two-party vote. For Rep. share, subtract from 100. | ||||||
| 2 Dem % of the two-party vote minus Rep % of the two-party vote | ||||||
| 3 Formally nonpartisan candidates assigned party labels based on state endorsements | ||||||
| Election results allocated into 2024 district boundaries based on population overlap. Calculations by John Johnson (johndjohnson.info). | ||||||
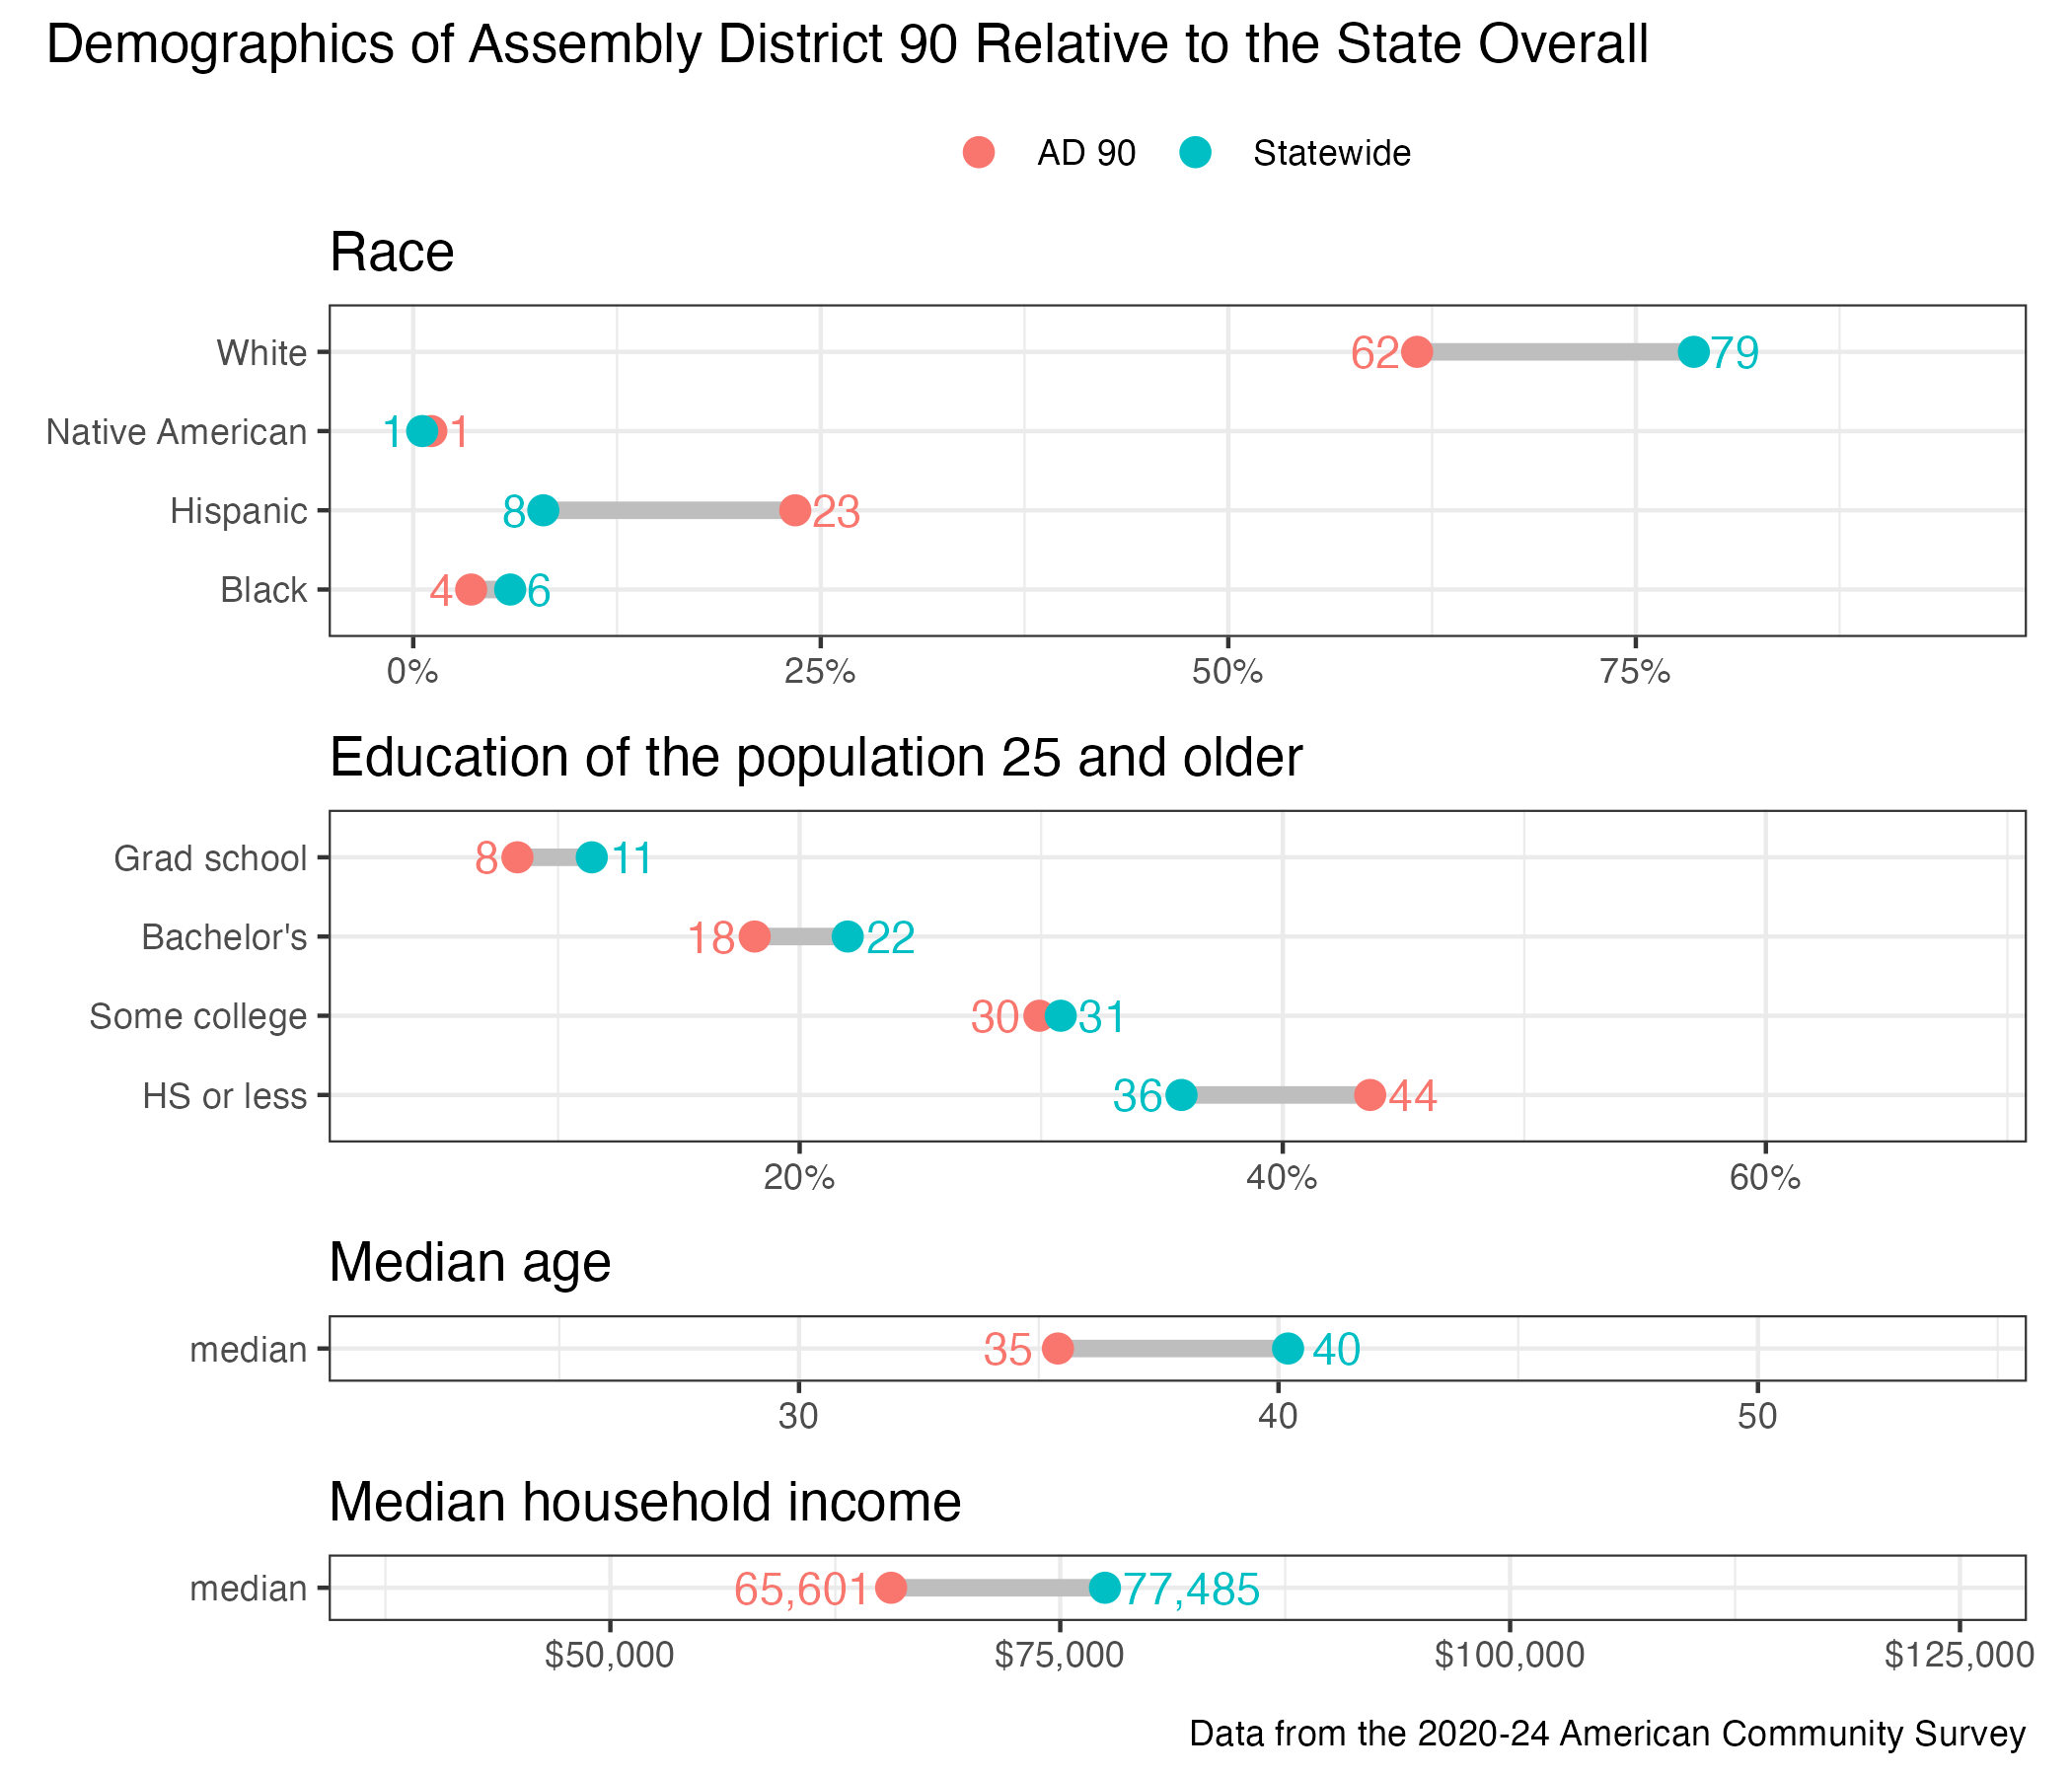
District demographics