79th Assembly District
District
Candidates
| Assembly District 79 Candidates on the Primary Ballot | ||
| Incumbent: Lisa Subeck | ||
Jan 1 thru July 30
|
||
|---|---|---|
| receipts | disbursements | |
| Republican | ||
| John Fons | $582.93 | $499.72 |
| Democratic | ||
| Lisa Subeck | $35,956.50 | $40,910.38 |
| Data from the 2026 July Continuing Report. Any amended reports might not yet be shown. | ||
Past election results
| Election Results in Wisconsin State Assembly District 79 | ||||||
votes
|
Dem. %1 |
margin (Dem. - Rep.)
|
||||
|---|---|---|---|---|---|---|
| total | Dem. | Rep. | votes | points2 | ||
| 2016 President | 36,330 | 29,032 | 5,229 | 84.7% | +23,803 | +69.5 |
| 2016 Senator | 36,191 | 29,318 | 6,314 | 82.3% | +23,004 | +64.6 |
| 2018 Governor | 34,017 | 28,317 | 5,114 | 84.7% | +23,203 | +69.4 |
| 2018 Senator | 33,987 | 29,003 | 4,941 | 85.4% | +24,062 | +70.9 |
| 2020 President | 38,219 | 32,477 | 5,153 | 86.3% | +27,324 | +72.6 |
| 2022 Governor | 33,399 | 29,290 | 3,935 | 88.2% | +25,355 | +76.3 |
| 2022 Senator | 33,423 | 28,924 | 4,439 | 86.7% | +24,485 | +73.4 |
| 2024 President | 37,783 | 32,094 | 4,975 | 86.6% | +27,119 | +73.2 |
| 2024 Senator | 37,588 | 32,109 | 5,052 | 86.4% | +27,057 | +72.8 |
| 2024 WI Assembly | 32,609 | 32,151 | 0 | 100.0% | +32,151 | +100.0 |
| 2025 WI Sup. Ct.3 | 31,440 | 28,151 | 3,264 | 89.6% | +24,887 | +79.2 |
| 1 Share of the two-party vote. For Rep. share, subtract from 100. | ||||||
| 2 Dem % of the two-party vote minus Rep % of the two-party vote | ||||||
| 3 Formally nonpartisan candidates assigned party labels based on state endorsements | ||||||
| Election results allocated into 2024 district boundaries based on population overlap. Calculations by John Johnson (johndjohnson.info). | ||||||
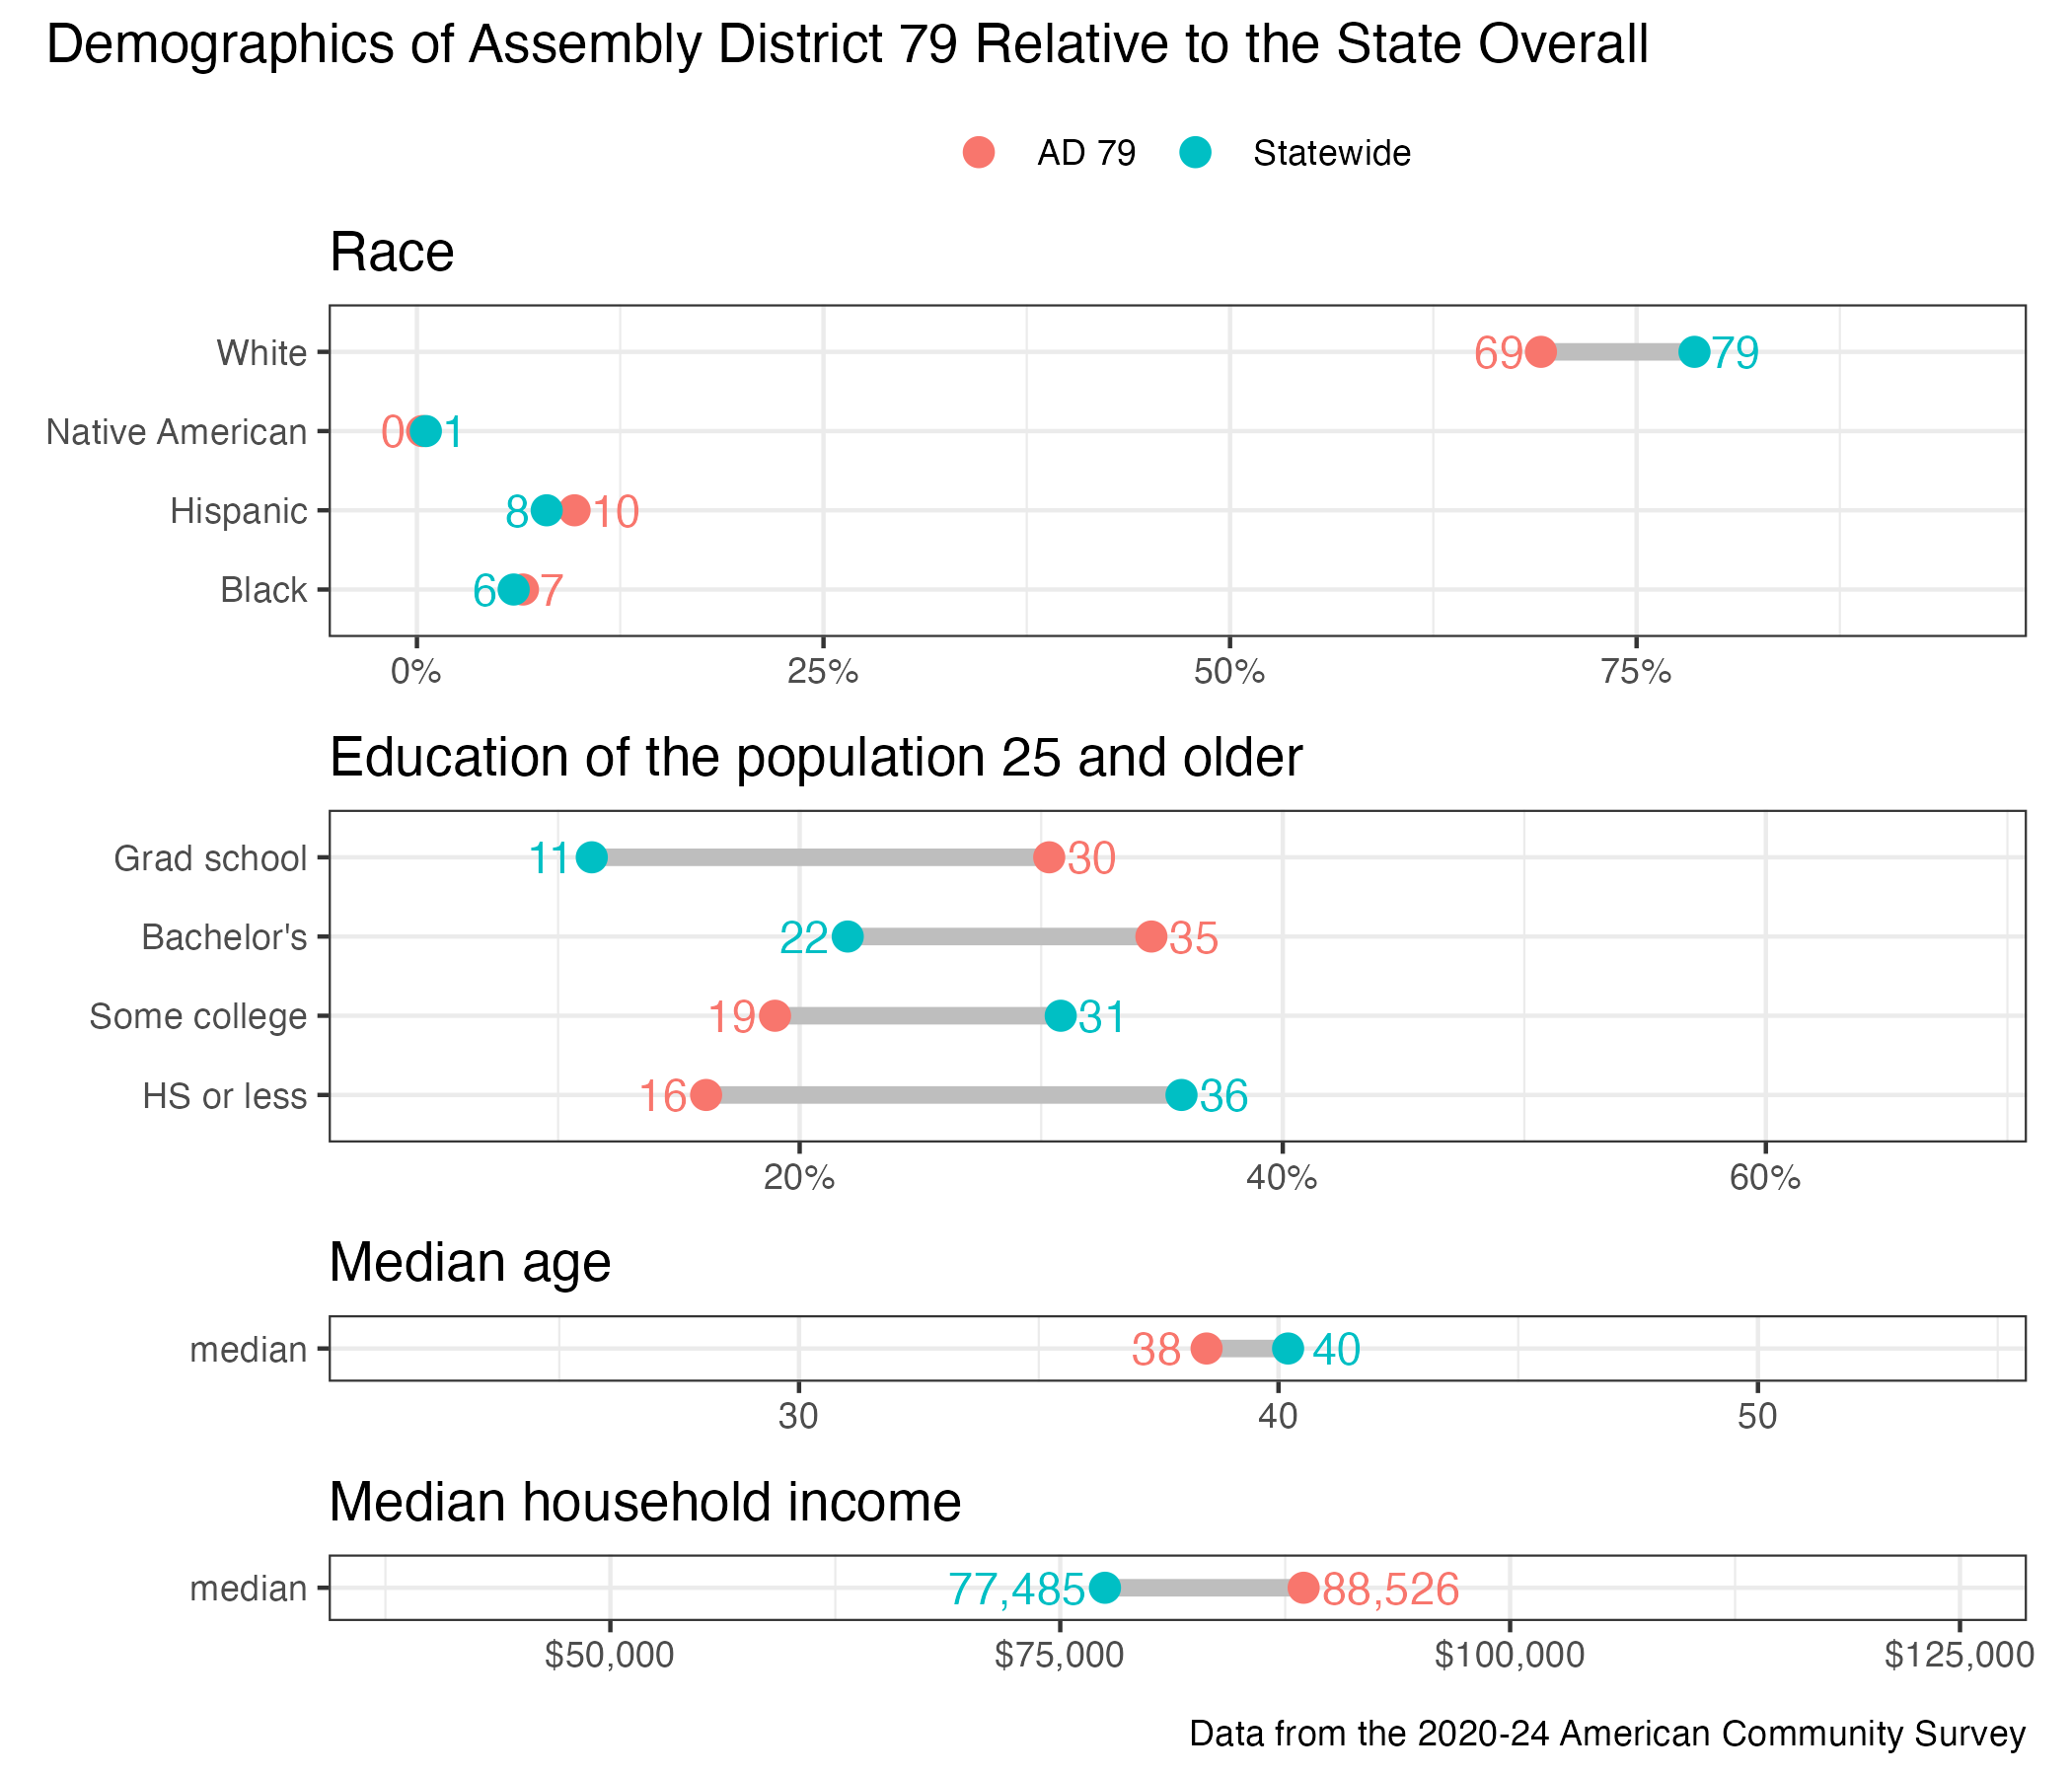
District demographics