53rd Assembly District
District
Candidates
| Assembly District 53 Candidates on the Primary Ballot | ||
| Incumbent: Dean R. Kaufert (Filed Notification of Noncandidacy) | ||
Jan 1 thru July 30
|
||
|---|---|---|
| receipts | disbursements | |
| Independent | ||
| Rachael Dowling | $380.00 | $0.00 |
| Republican | ||
| David Daniels | $7,372.47 | $24.05 |
| Democratic | ||
| Becky Nichols | $8,665.55 | $910.37 |
| Data from the 2026 July Continuing Report. Any amended reports might not yet be shown. | ||
Past election results
| Election Results in Wisconsin State Assembly District 53 | ||||||
votes
|
Dem. %1 |
margin (Dem. - Rep.)
|
||||
|---|---|---|---|---|---|---|
| total | Dem. | Rep. | votes | points2 | ||
| 2016 President | 31,067 | 13,930 | 14,554 | 48.9% | −624 | −2.2 |
| 2016 Senator | 30,816 | 13,499 | 15,836 | 46.0% | −2,337 | −8.0 |
| 2018 Governor | 24,973 | 12,351 | 11,921 | 50.9% | +430 | +1.8 |
| 2018 Senator | 24,921 | 14,005 | 10,872 | 56.3% | +3,133 | +12.6 |
| 2020 President | 31,645 | 16,120 | 14,754 | 52.2% | +1,366 | +4.4 |
| 2022 Governor | 24,715 | 13,219 | 11,104 | 54.3% | +2,115 | +8.7 |
| 2022 Senator | 24,634 | 12,759 | 11,802 | 51.9% | +957 | +3.9 |
| 2024 President | 32,108 | 16,470 | 15,068 | 52.2% | +1,402 | +4.4 |
| 2024 Senator | 31,809 | 16,383 | 14,440 | 53.2% | +1,943 | +6.3 |
| 2024 WI Assembly | 31,280 | 15,437 | 15,801 | 49.4% | −364 | −1.2 |
| 2025 WI Sup. Ct.3 | 21,168 | 12,480 | 8,678 | 59.0% | +3,802 | +18.0 |
| 1 Share of the two-party vote. For Rep. share, subtract from 100. | ||||||
| 2 Dem % of the two-party vote minus Rep % of the two-party vote | ||||||
| 3 Formally nonpartisan candidates assigned party labels based on state endorsements | ||||||
| Election results allocated into 2024 district boundaries based on population overlap. Calculations by John Johnson (johndjohnson.info). | ||||||
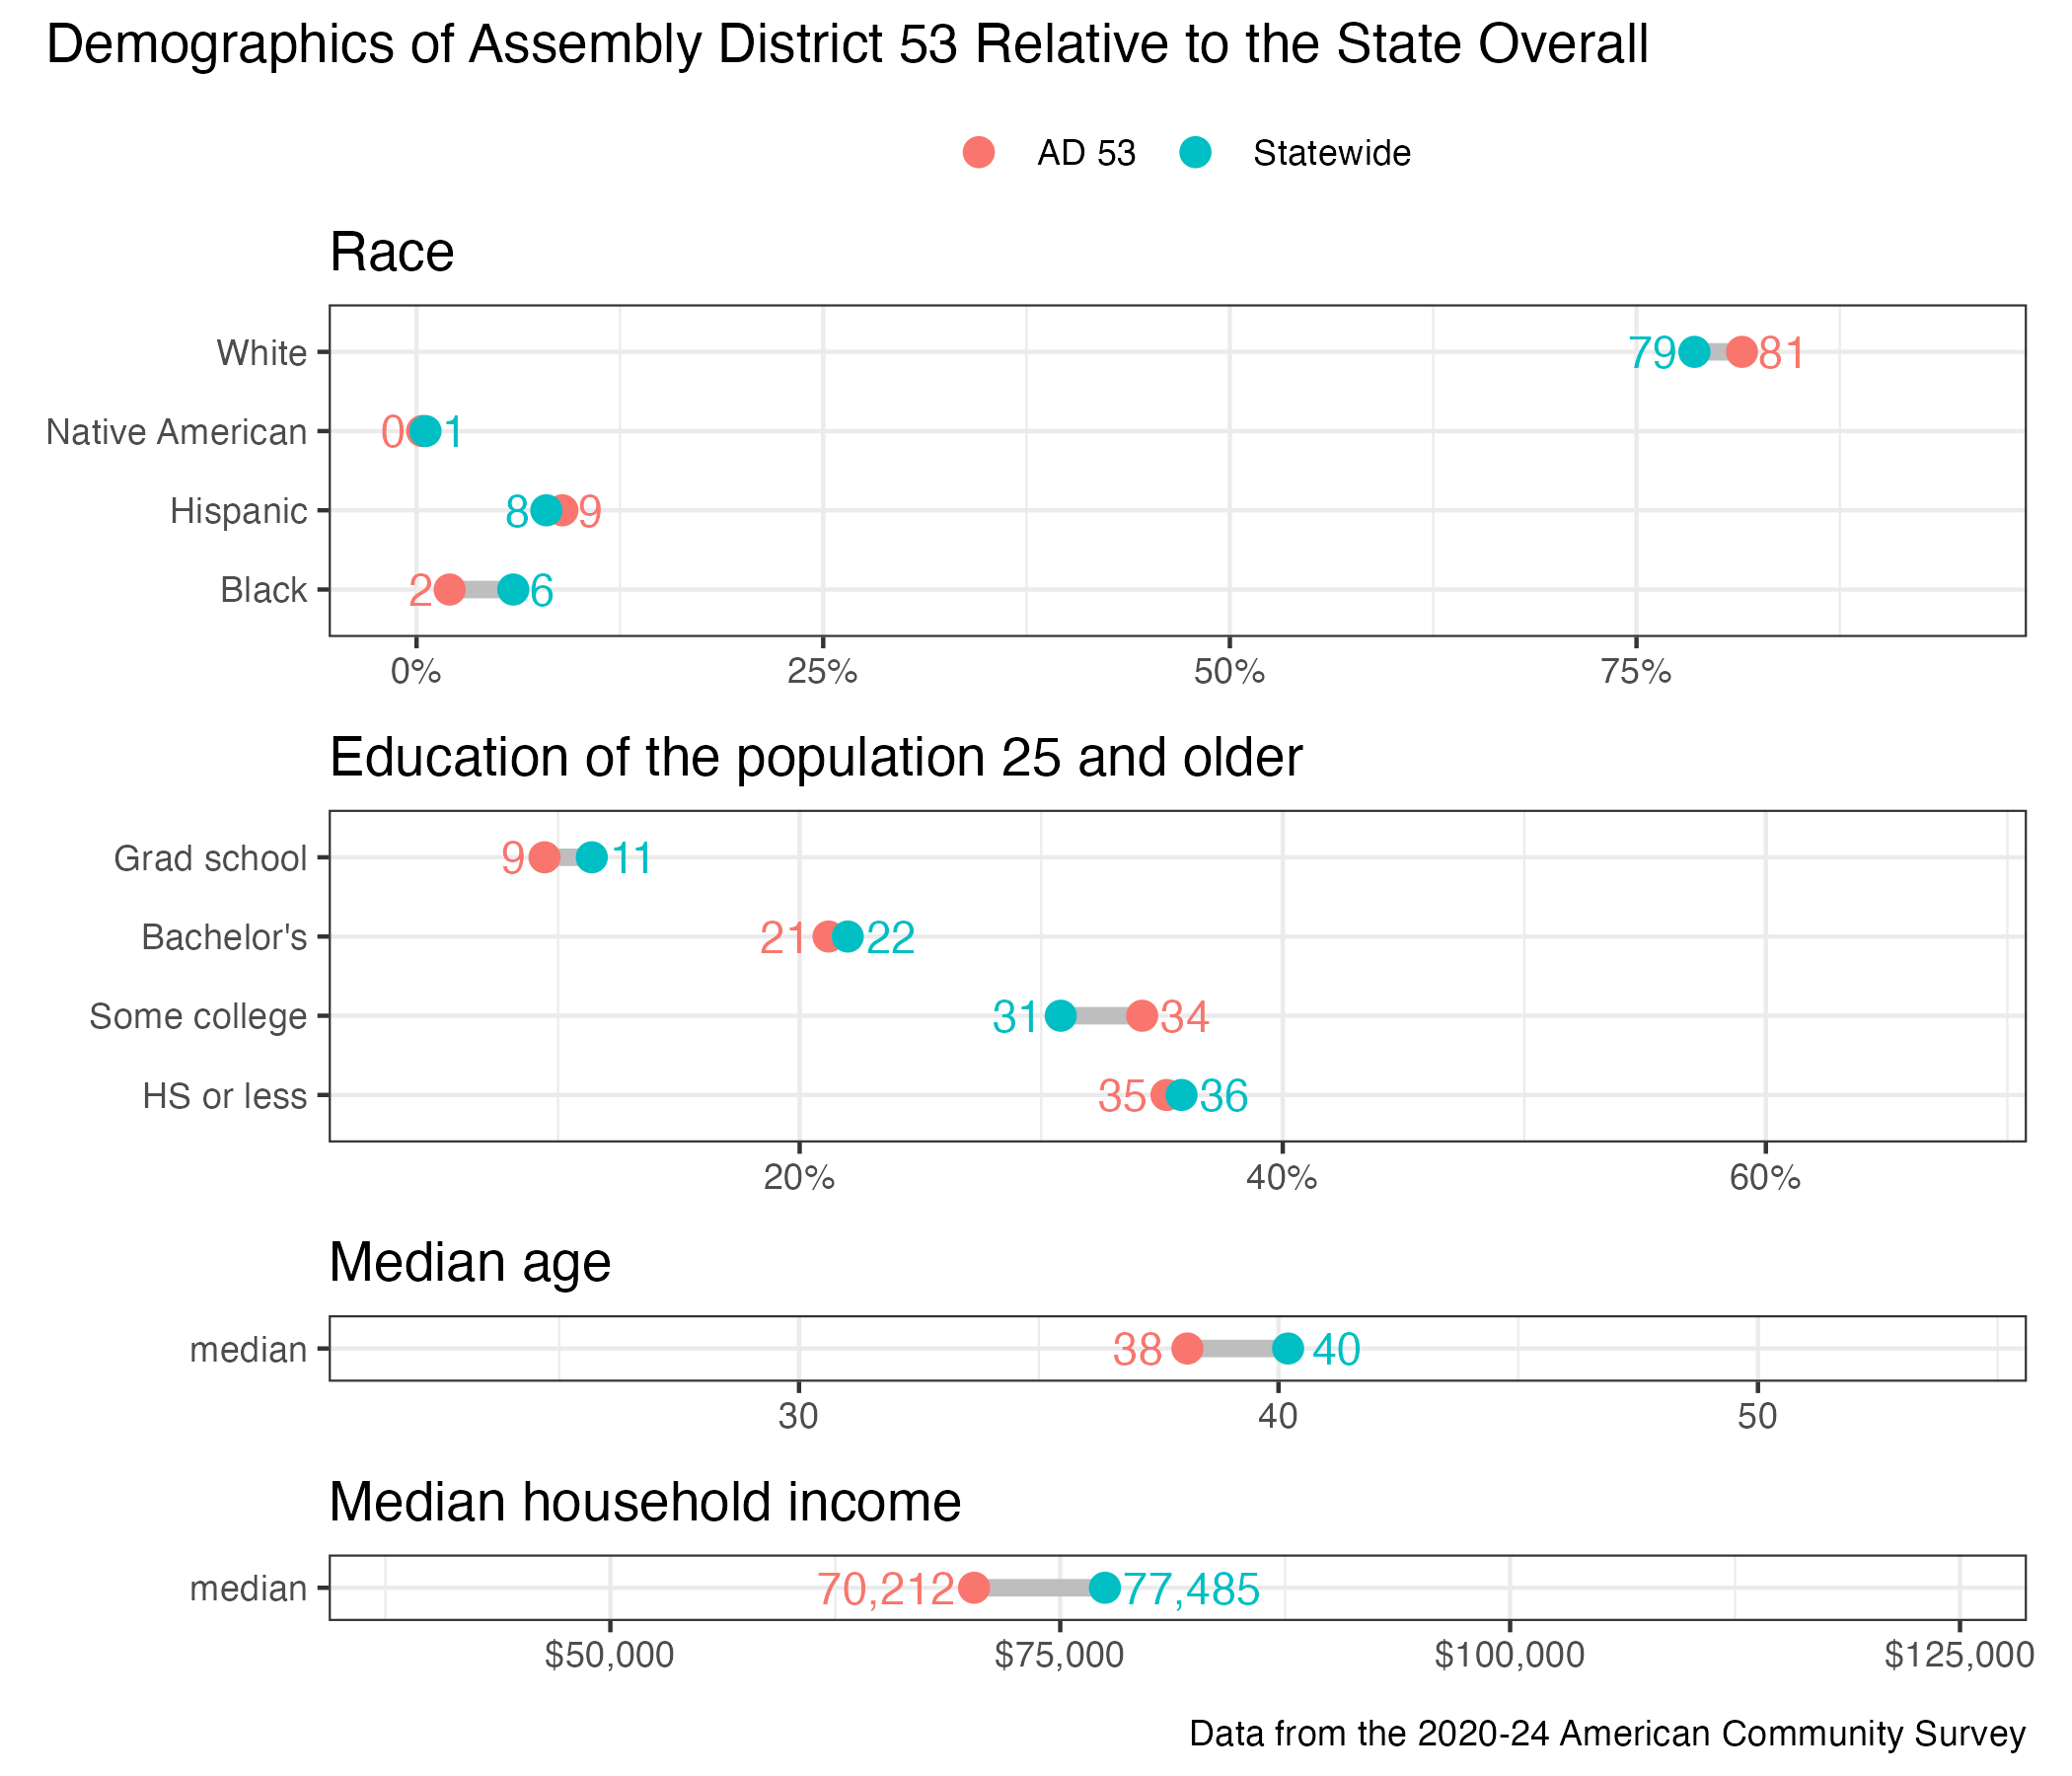
District demographics