14th Assembly District
District
Candidates
| Assembly District 14 Candidates on the Primary Ballot | ||
| Incumbent: Angelito Tenorio | ||
Jan 1 thru July 30
|
||
|---|---|---|
| receipts | disbursements | |
| Republican | ||
| AmyRose Murphy | $2,010.00 | $1,681.35 |
| Democratic | ||
| Angelito Tenorio | $7,729.35 | $6,851.14 |
| Data from the 2026 July Continuing Report. Any amended reports might not yet be shown. | ||
Past election results
| Election Results in Wisconsin State Assembly District 14 | ||||||
votes
|
Dem. %1 |
margin (Dem. - Rep.)
|
||||
|---|---|---|---|---|---|---|
| total | Dem. | Rep. | votes | points2 | ||
| 2016 President | 29,577 | 13,821 | 13,354 | 50.9% | +467 | +1.7 |
| 2016 Senator | 29,239 | 13,599 | 14,704 | 48.0% | −1,105 | −3.9 |
| 2018 Governor | 26,100 | 13,182 | 12,230 | 51.9% | +952 | +3.7 |
| 2018 Senator | 25,898 | 14,686 | 11,135 | 56.9% | +3,551 | +13.8 |
| 2020 President | 30,103 | 16,215 | 13,258 | 55.0% | +2,957 | +10.0 |
| 2022 Governor | 23,251 | 13,184 | 9,749 | 57.5% | +3,435 | +15.0 |
| 2022 Senator | 23,200 | 12,863 | 10,272 | 55.6% | +2,591 | +11.2 |
| 2024 President | 31,073 | 16,765 | 13,621 | 55.2% | +3,144 | +10.3 |
| 2024 Senator | 30,670 | 16,837 | 13,008 | 56.4% | +3,829 | +12.8 |
| 2024 WI Assembly | 29,693 | 15,637 | 12,896 | 54.8% | +2,741 | +9.6 |
| 2025 WI Sup. Ct.3 | 20,198 | 12,556 | 7,627 | 62.2% | +4,929 | +24.4 |
| 1 Share of the two-party vote. For Rep. share, subtract from 100. | ||||||
| 2 Dem % of the two-party vote minus Rep % of the two-party vote | ||||||
| 3 Formally nonpartisan candidates assigned party labels based on state endorsements | ||||||
| Election results allocated into 2024 district boundaries based on population overlap. Calculations by John Johnson (johndjohnson.info). | ||||||
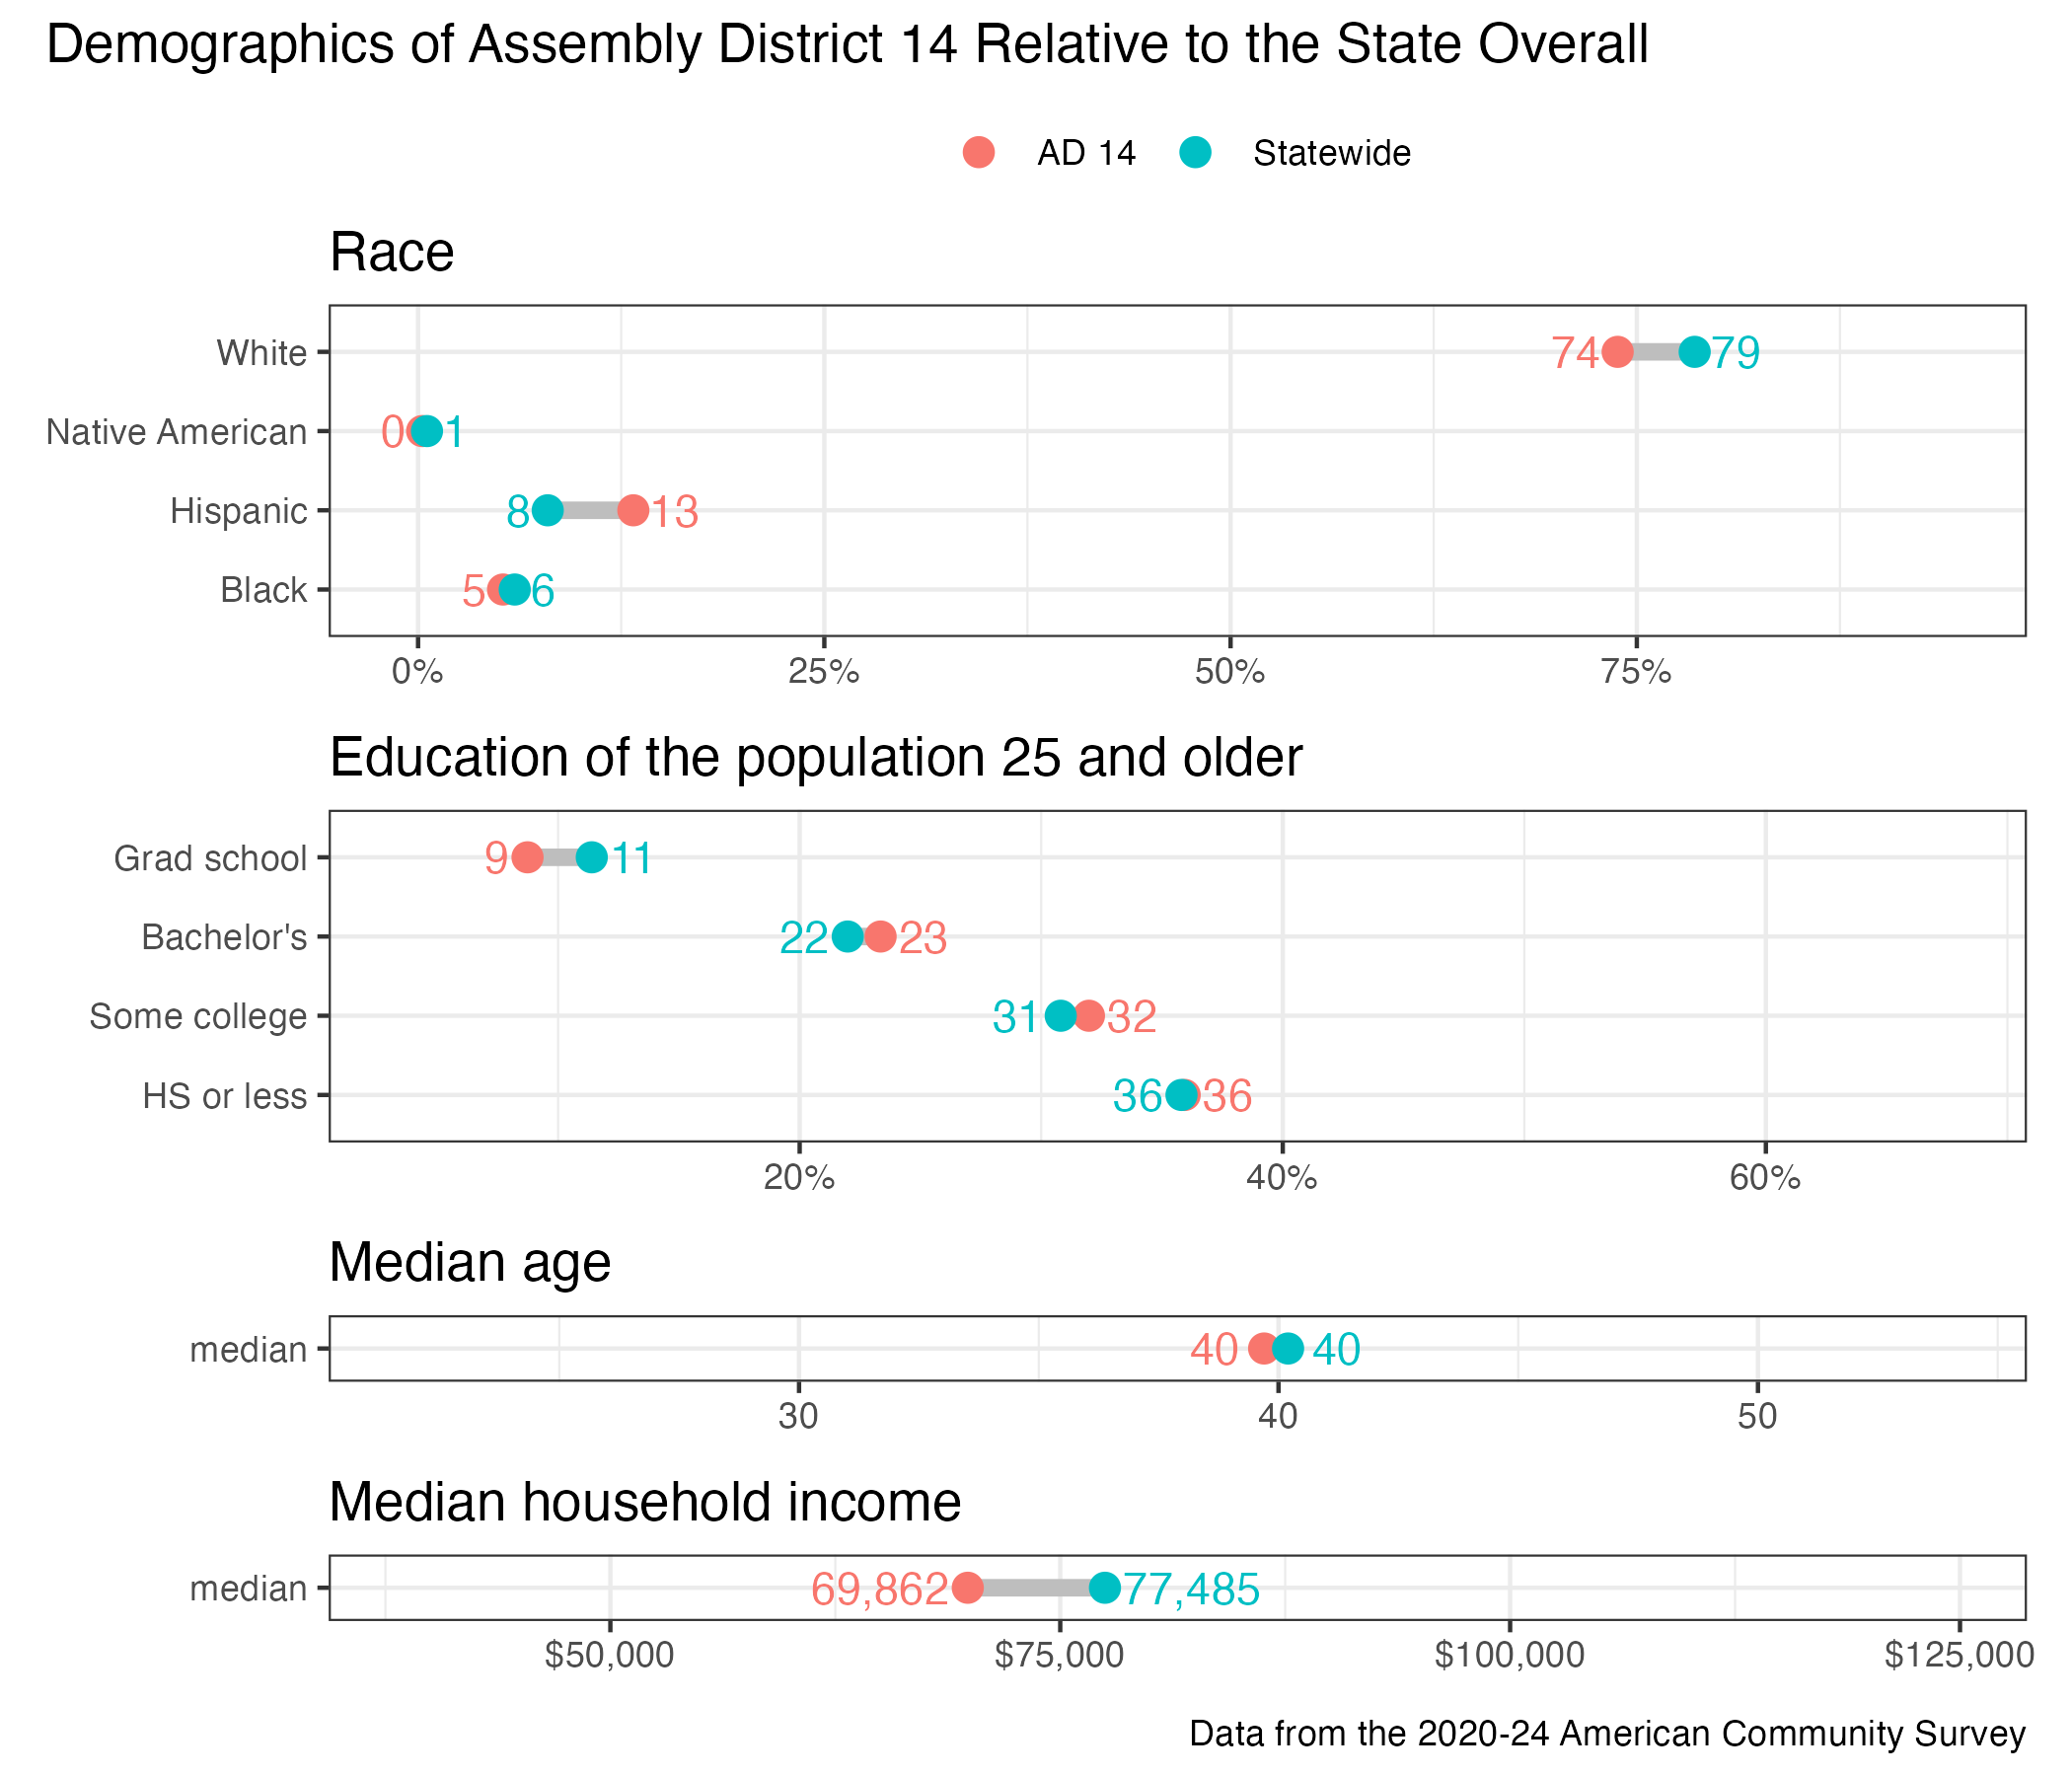
District demographics