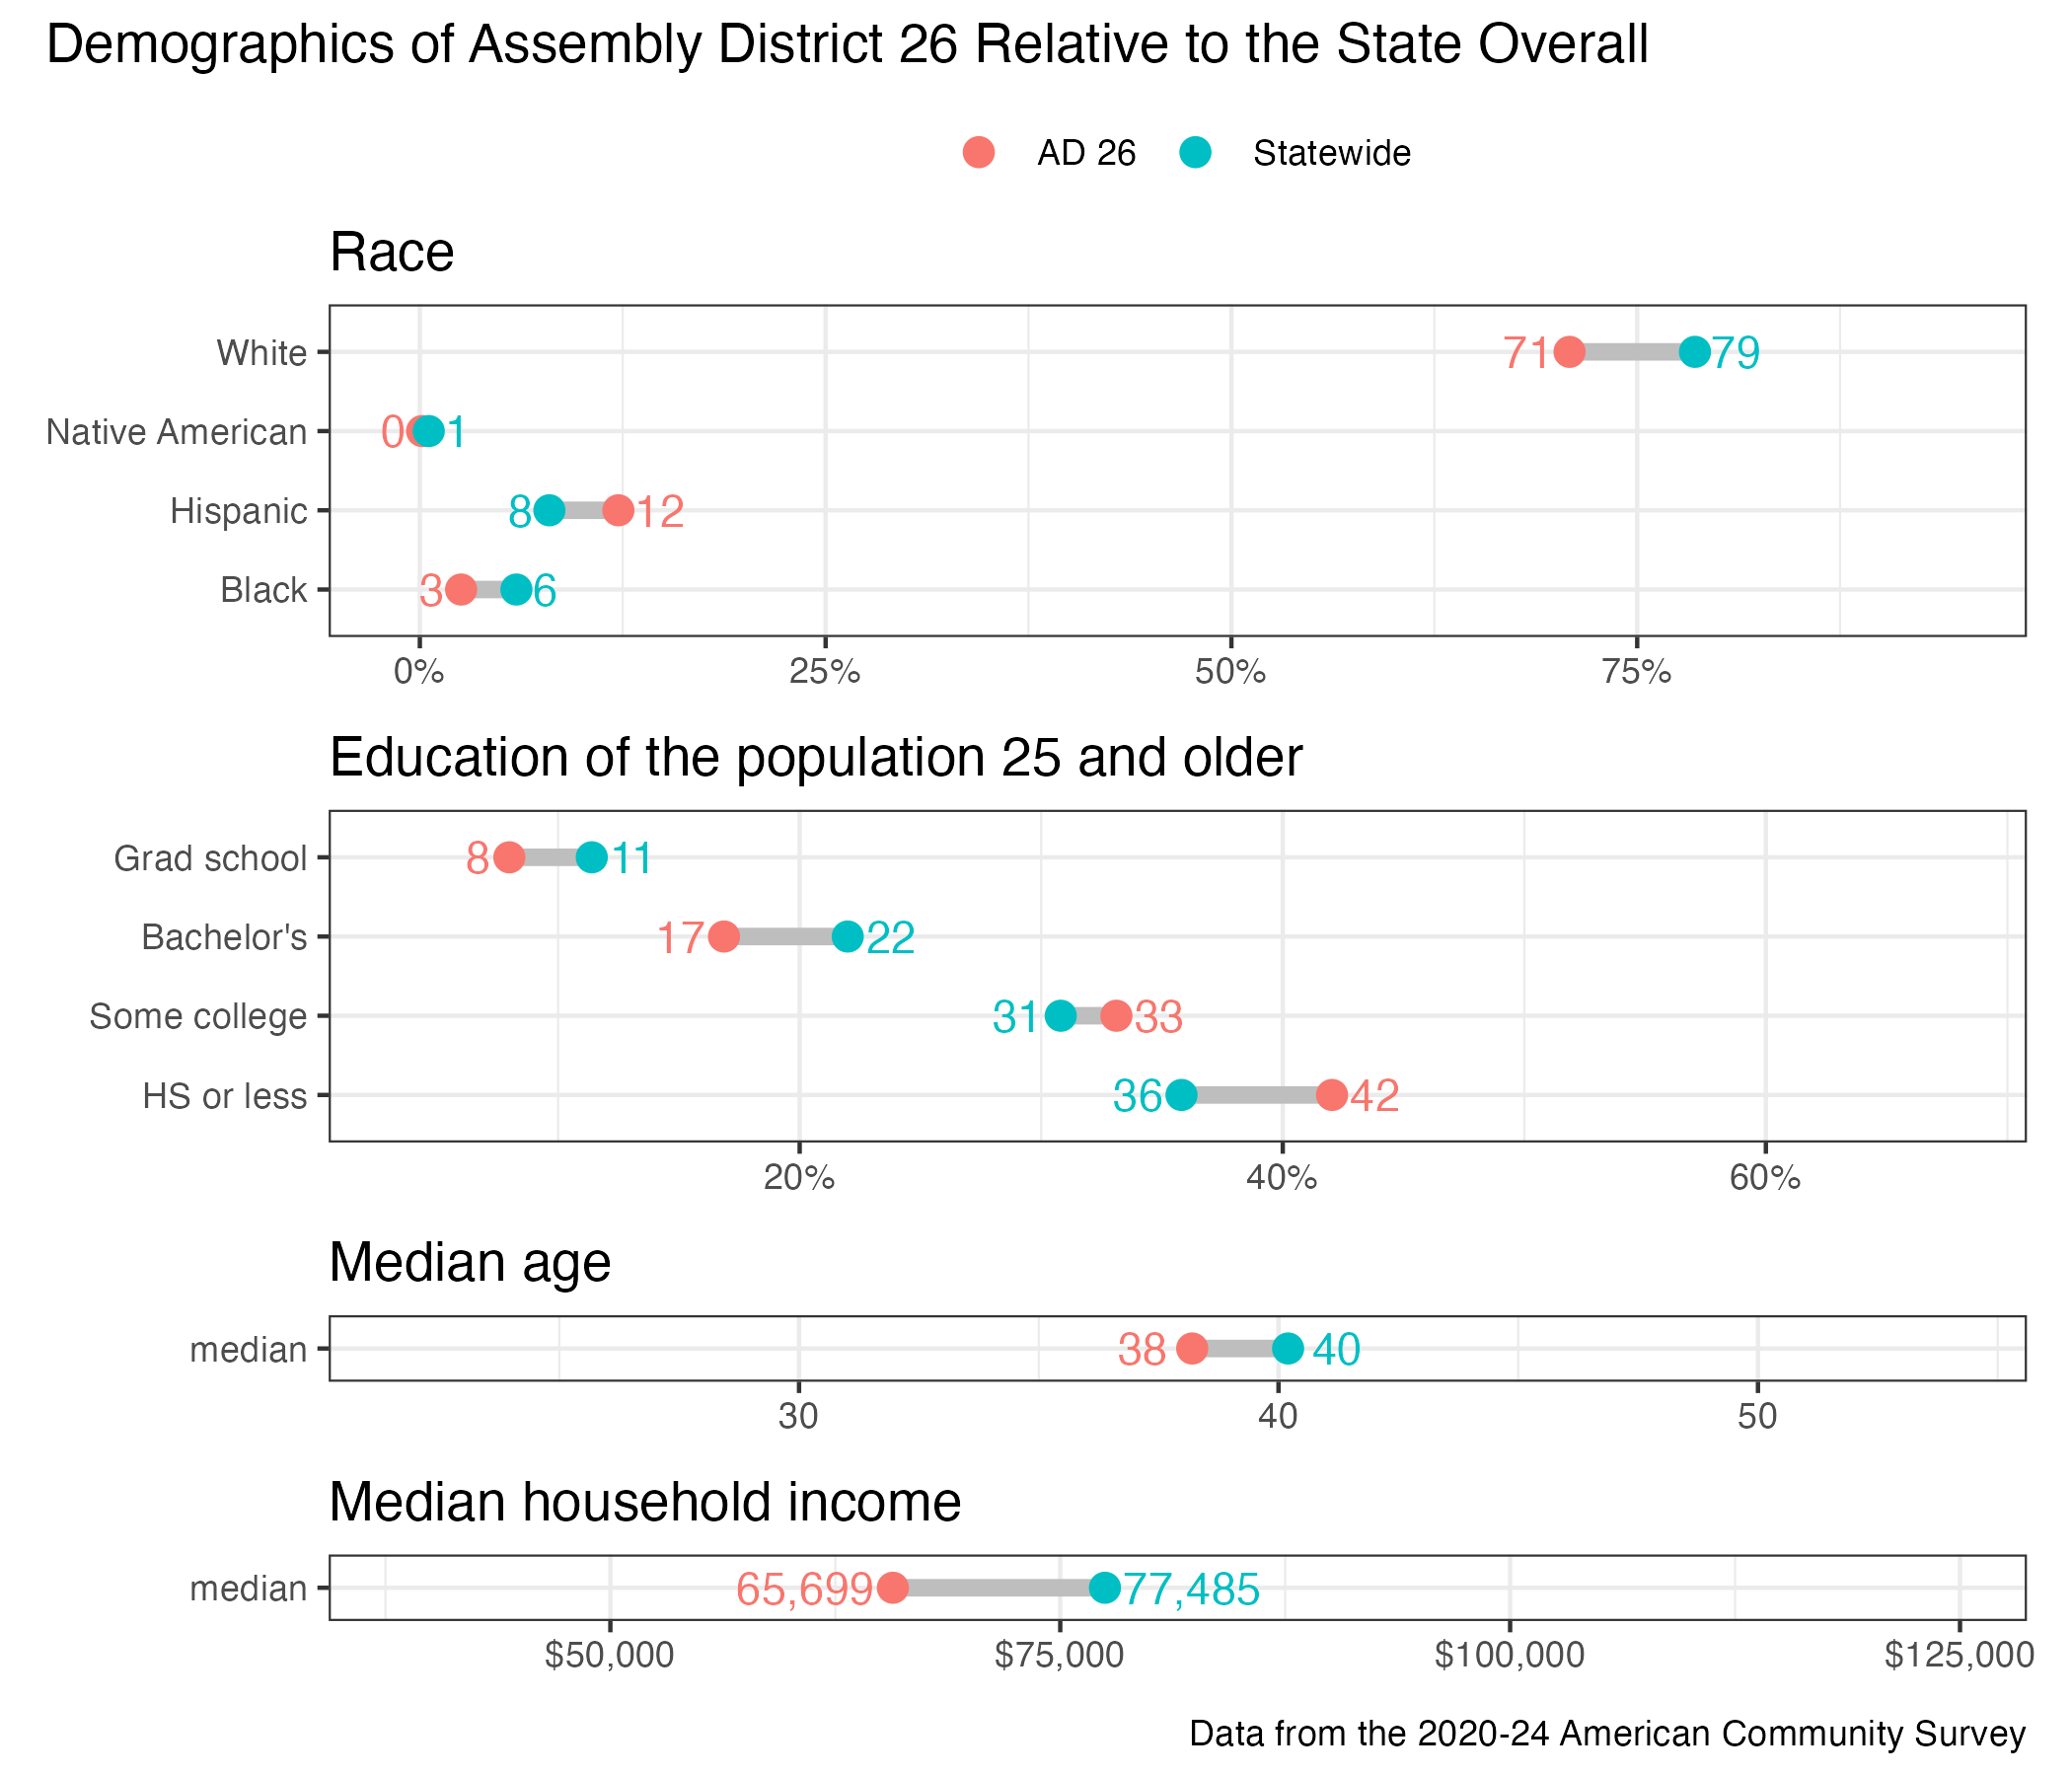
26th Assembly District
District
Candidates
| Assembly District 26 Candidates on the Primary Ballot | ||
| Incumbent: Joe Sheehan | ||
Jan 1 thru July 30
|
||
|---|---|---|
| receipts | disbursements | |
| Republican | ||
| Tyler Schneekloth | $756.93 | $756.93 |
| James Brotz | $0.00 | $165.30 |
| John Belanger | $0.00 | $24.00 |
| Democratic | ||
| Joe Sheehan | $32,754.58 | $11,301.74 |
| Data from the 2026 July Continuing Report. Any amended reports might not yet be shown. | ||
Past election results
| Election Results in Wisconsin State Assembly District 26 | ||||||
votes
|
Dem. %1 |
margin (Dem. - Rep.)
|
||||
|---|---|---|---|---|---|---|
| total | Dem. | Rep. | votes | points2 | ||
| 2016 President | 26,478 | 12,662 | 11,808 | 51.7% | +854 | +3.5 |
| 2016 Senator | 26,284 | 12,372 | 12,903 | 48.9% | −531 | −2.1 |
| 2018 Governor | 23,133 | 11,309 | 11,337 | 49.9% | −28 | −0.1 |
| 2018 Senator | 22,970 | 12,793 | 10,138 | 55.8% | +2,655 | +11.6 |
| 2020 President | 29,133 | 14,776 | 13,742 | 51.8% | +1,034 | +3.6 |
| 2022 Governor | 22,610 | 11,774 | 10,524 | 52.8% | +1,250 | +5.6 |
| 2022 Senator | 22,567 | 11,379 | 11,123 | 50.6% | +256 | +1.1 |
| 2024 President | 29,734 | 15,014 | 14,224 | 51.4% | +790 | +2.7 |
| 2024 Senator | 29,380 | 14,983 | 13,607 | 52.4% | +1,376 | +4.8 |
| 2024 WI Assembly | 28,993 | 14,887 | 14,042 | 51.5% | +845 | +2.9 |
| 2025 WI Sup. Ct.3 | 20,089 | 11,420 | 8,648 | 56.9% | +2,772 | +13.8 |
| 1 Share of the two-party vote. For Rep. share, subtract from 100. | ||||||
| 2 Dem % of the two-party vote minus Rep % of the two-party vote | ||||||
| 3 Formally nonpartisan candidates assigned party labels based on state endorsements | ||||||
| Election results allocated into 2024 district boundaries based on population overlap. Calculations by John Johnson (johndjohnson.info). | ||||||
District demographics