9th Assembly District
District
Candidates
| Assembly District 9 Candidates on the Primary Ballot | ||
| Incumbent: PRISCILLA A. PRADO | ||
Jan 1 thru July 30
|
||
|---|---|---|
| receipts | disbursements | |
| Republican | ||
| Samuel Guerreo | NA | NA |
| Democratic | ||
| Mimi Reza | $1,050.00 | $520.11 |
| Priscilla A. Prado | $19,339.00 | $11,506.19 |
| Data from the 2026 July Continuing Report. Any amended reports might not yet be shown. | ||
Past election results
| Election Results in Wisconsin State Assembly District 9 | ||||||
votes
|
Dem. %1 |
margin (Dem. - Rep.)
|
||||
|---|---|---|---|---|---|---|
| total | Dem. | Rep. | votes | points2 | ||
| 2016 President | 18,470 | 12,772 | 4,667 | 73.2% | +8,105 | +46.5 |
| 2016 Senator | 17,976 | 12,245 | 5,096 | 70.6% | +7,149 | +41.2 |
| 2018 Governor | 15,578 | 11,167 | 4,066 | 73.3% | +7,101 | +46.6 |
| 2018 Senator | 15,517 | 11,832 | 3,640 | 76.5% | +8,192 | +52.9 |
| 2020 President | 18,965 | 13,305 | 5,369 | 71.2% | +7,936 | +42.5 |
| 2022 Governor | 12,362 | 9,038 | 3,184 | 73.9% | +5,854 | +47.9 |
| 2022 Senator | 12,474 | 8,934 | 3,496 | 71.9% | +5,438 | +43.7 |
| 2024 President | 18,989 | 12,478 | 6,075 | 67.3% | +6,403 | +34.5 |
| 2024 Senator | 18,441 | 12,722 | 5,163 | 71.1% | +7,559 | +42.3 |
| 2024 WI Assembly | 17,737 | 12,449 | 5,234 | 70.4% | +7,215 | +40.8 |
| 2025 WI Sup. Ct.3 | 10,460 | 8,078 | 2,371 | 77.3% | +5,707 | +54.6 |
| 1 Share of the two-party vote. For Rep. share, subtract from 100. | ||||||
| 2 Dem % of the two-party vote minus Rep % of the two-party vote | ||||||
| 3 Formally nonpartisan candidates assigned party labels based on state endorsements | ||||||
| Election results allocated into 2024 district boundaries based on population overlap. Calculations by John Johnson (johndjohnson.info). | ||||||
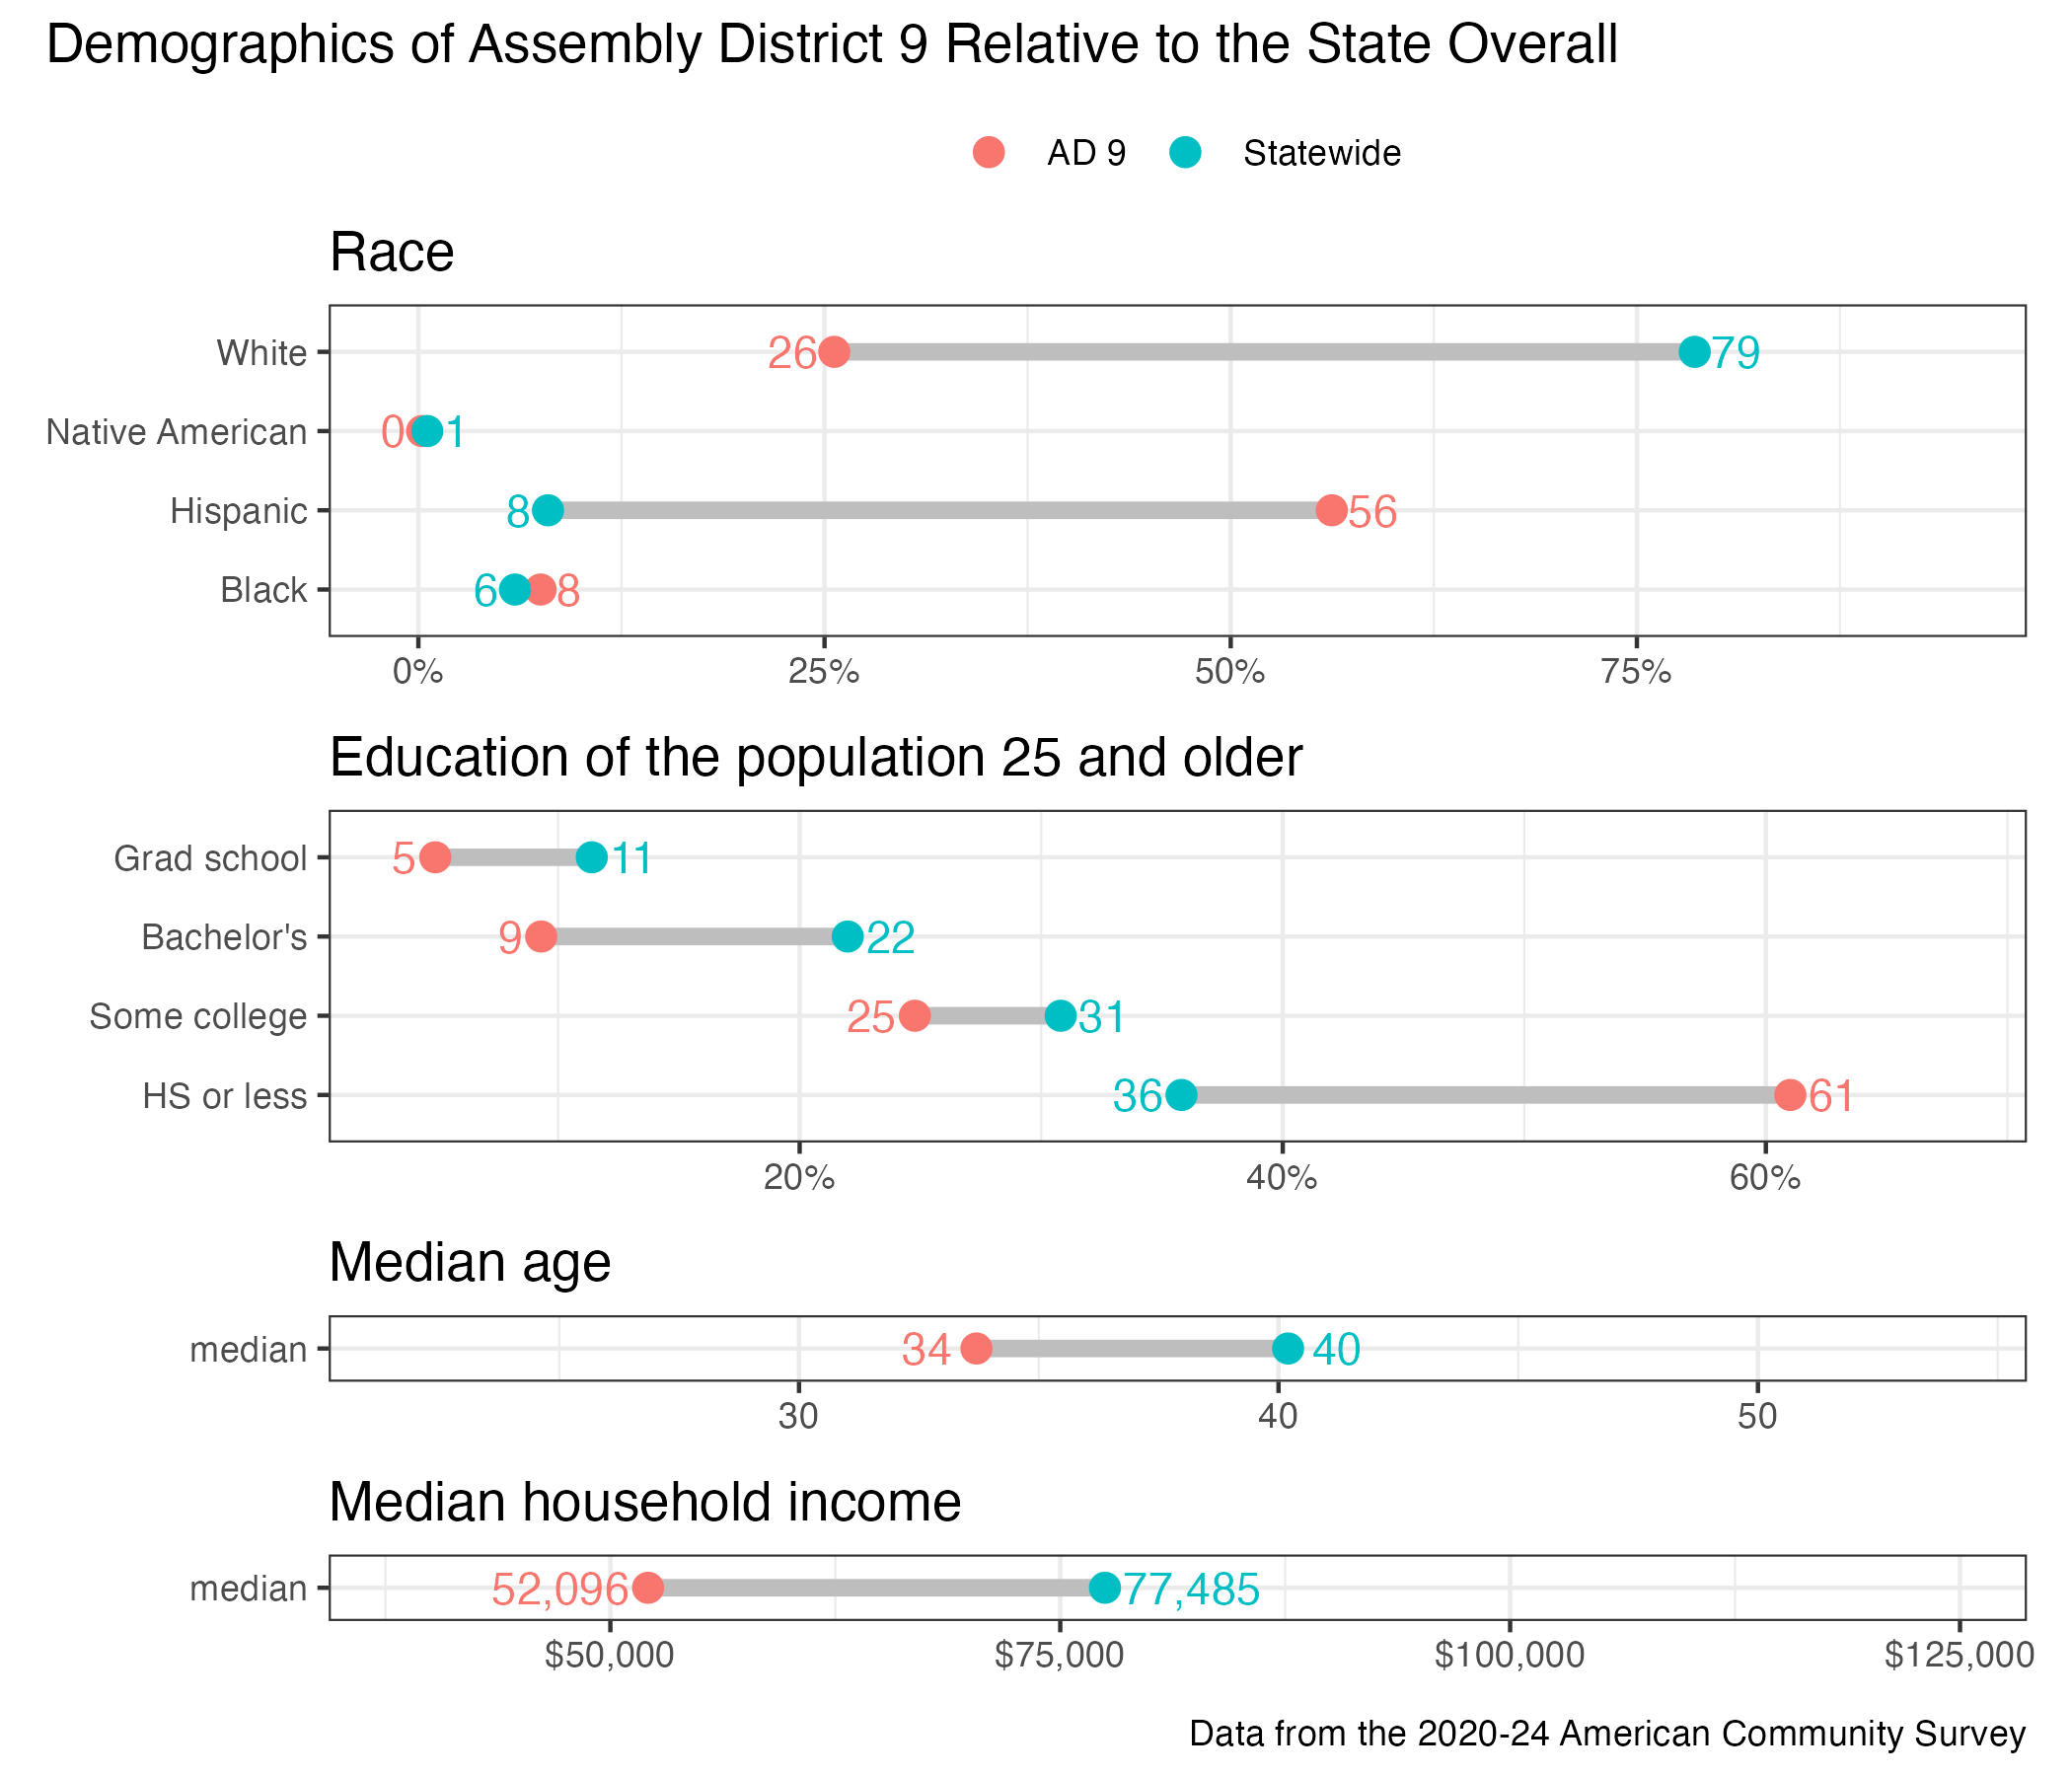
District demographics