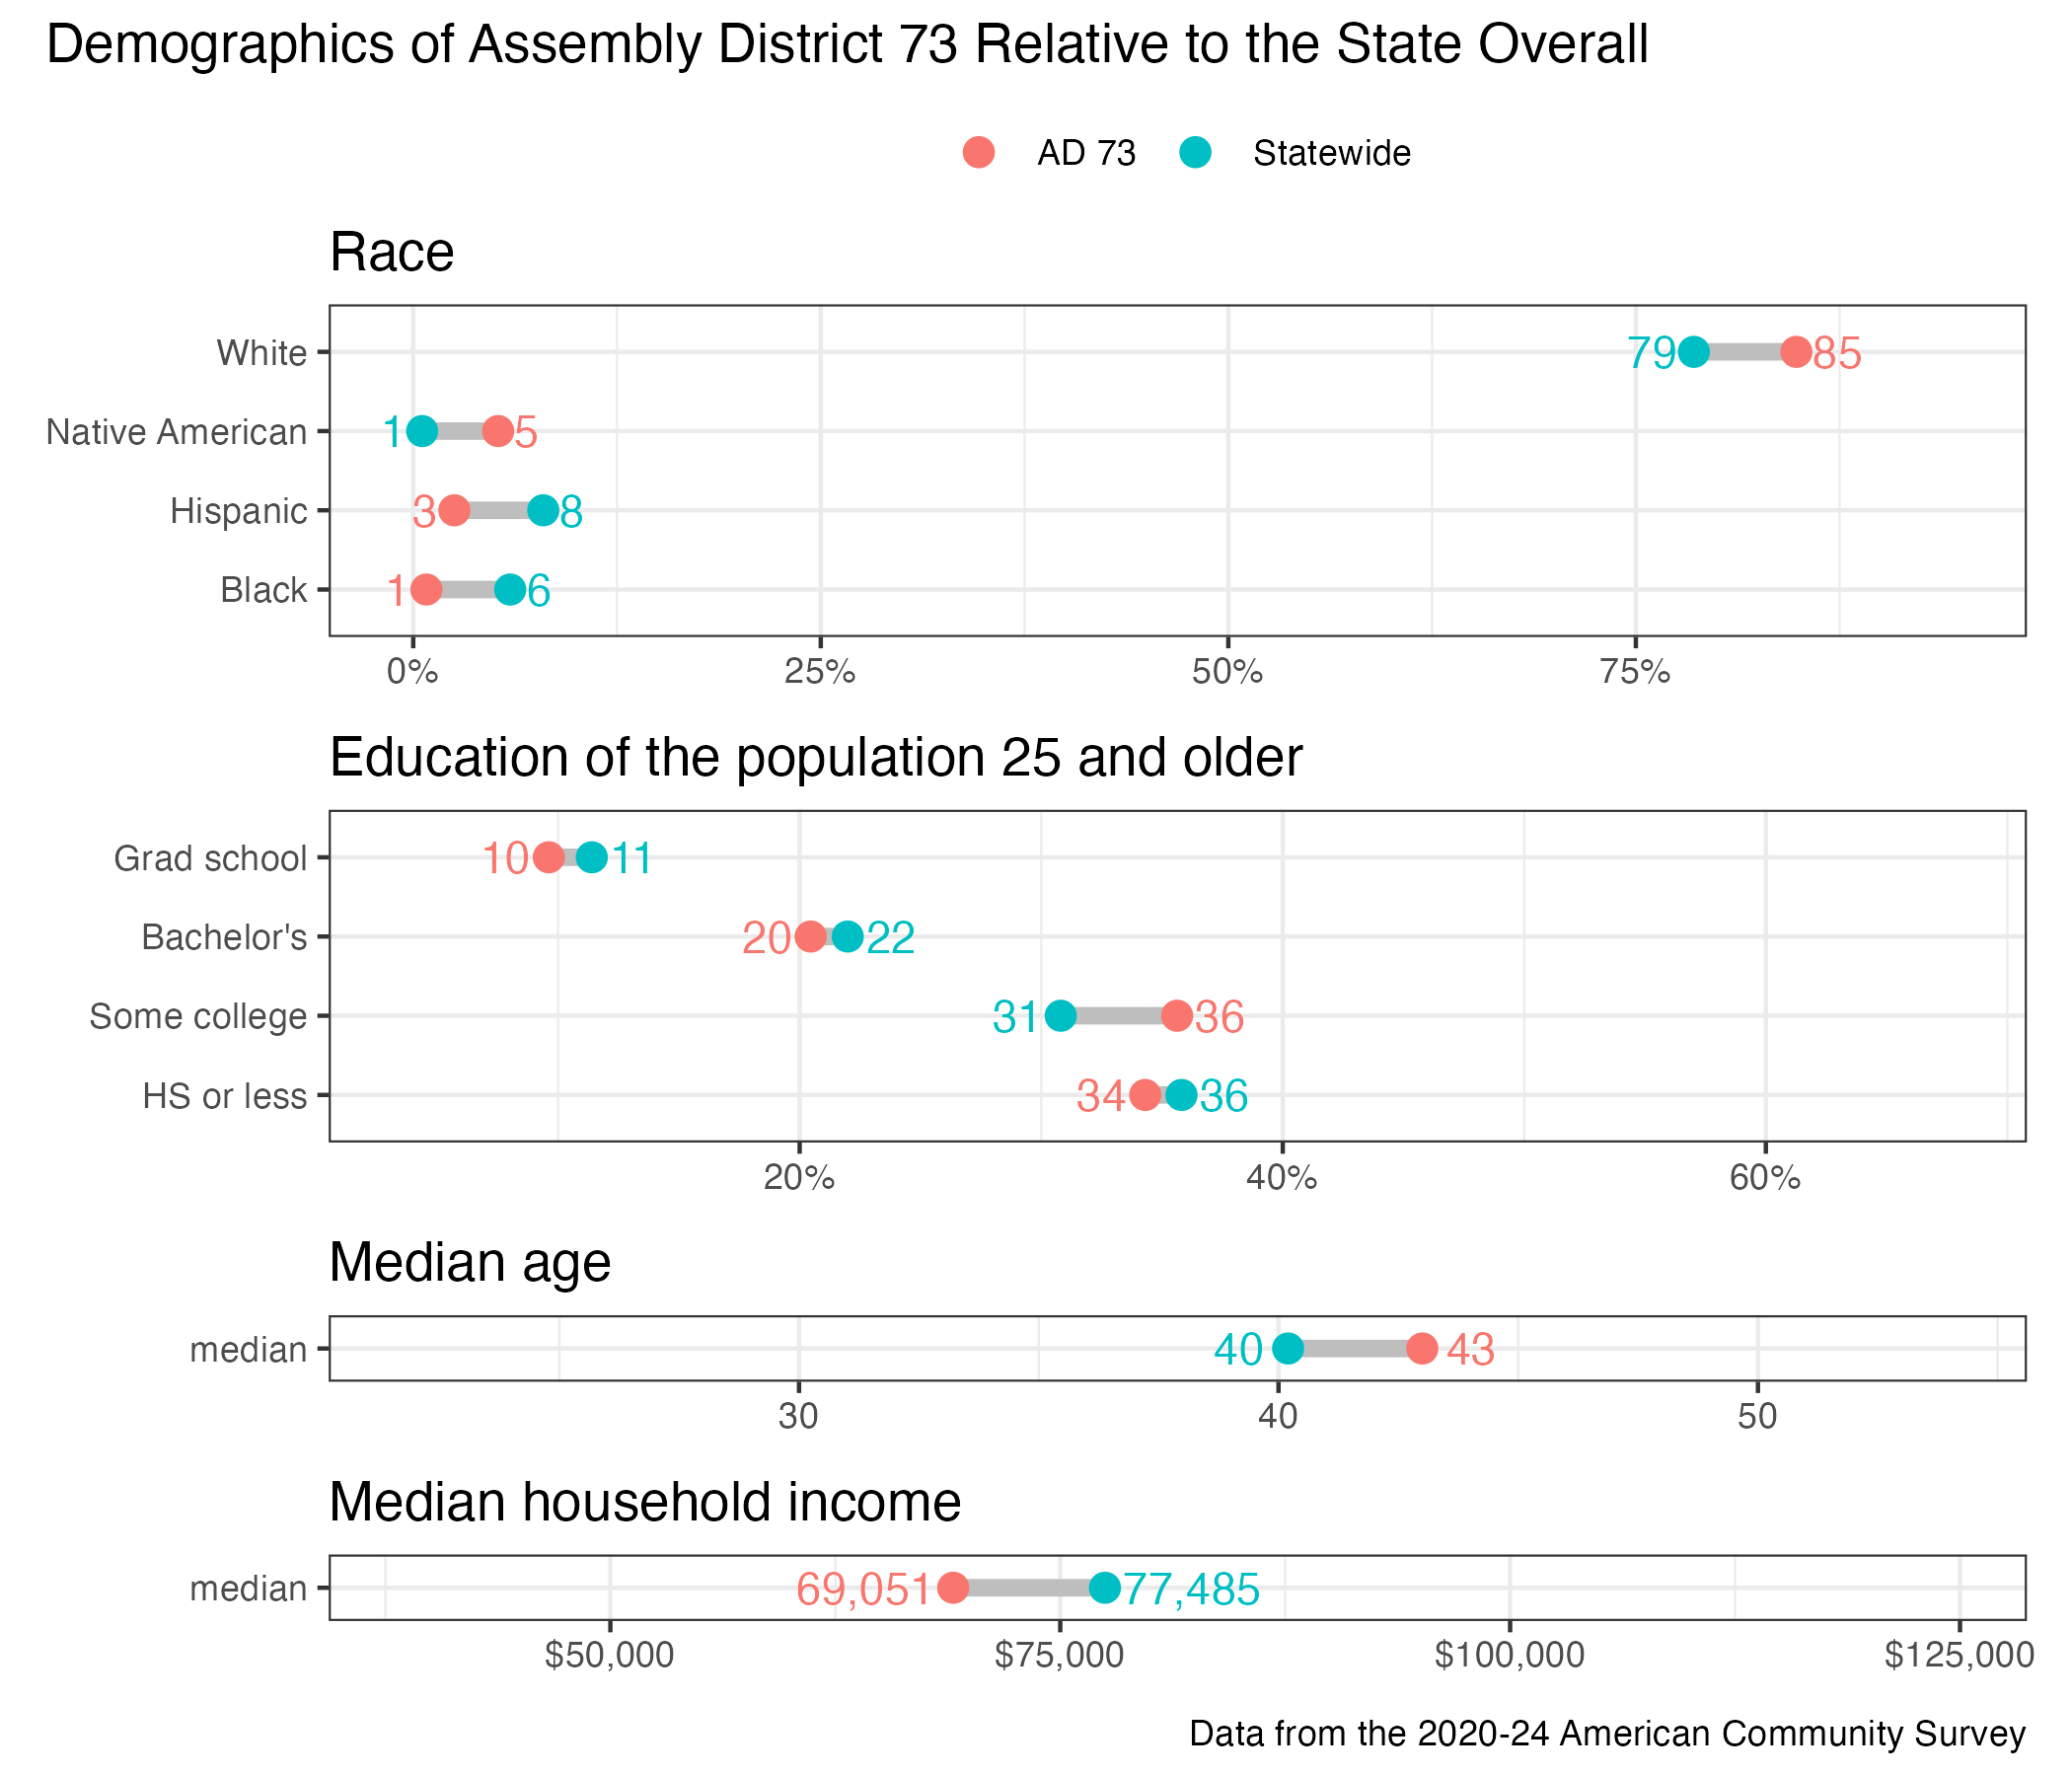
73rd Assembly District
District
Candidates
| Assembly District 73 Candidates on the Primary Ballot | ||
| Incumbent: Angela Stroud | ||
Jan 1 thru July 30
|
||
|---|---|---|
| receipts | disbursements | |
| Republican | ||
| Frank Kostka | $0.00 | $121.35 |
| Democratic | ||
| Angela Stroud | $9,435.00 | $5,098.24 |
| Data from the 2026 July Continuing Report. Any amended reports might not yet be shown. | ||
Past election results
| Election Results in Wisconsin State Assembly District 73 | ||||||
votes
|
Dem. %1 |
margin (Dem. - Rep.)
|
||||
|---|---|---|---|---|---|---|
| total | Dem. | Rep. | votes | points2 | ||
| 2016 President | 30,622 | 16,576 | 11,991 | 58.0% | +4,585 | +16.0 |
| 2016 Senator | 30,003 | 17,262 | 11,713 | 59.6% | +5,549 | +19.2 |
| 2018 Governor | 26,125 | 16,270 | 9,198 | 63.9% | +7,072 | +27.8 |
| 2018 Senator | 26,001 | 17,304 | 8,682 | 66.6% | +8,622 | +33.2 |
| 2020 President | 33,484 | 19,523 | 13,323 | 59.4% | +6,200 | +18.9 |
| 2022 Governor | 26,016 | 16,068 | 9,677 | 62.4% | +6,391 | +24.8 |
| 2022 Senator | 26,014 | 15,615 | 10,359 | 60.1% | +5,256 | +20.2 |
| 2024 President | 33,934 | 19,277 | 14,025 | 57.9% | +5,252 | +15.8 |
| 2024 Senator | 33,561 | 19,456 | 13,270 | 59.5% | +6,186 | +18.9 |
| 2024 WI Assembly | 33,033 | 19,265 | 13,720 | 58.4% | +5,545 | +16.8 |
| 2025 WI Sup. Ct.3 | 23,166 | 14,900 | 8,249 | 64.4% | +6,651 | +28.7 |
| 1 Share of the two-party vote. For Rep. share, subtract from 100. | ||||||
| 2 Dem % of the two-party vote minus Rep % of the two-party vote | ||||||
| 3 Formally nonpartisan candidates assigned party labels based on state endorsements | ||||||
| Election results allocated into 2024 district boundaries based on population overlap. Calculations by John Johnson (johndjohnson.info). | ||||||
District demographics