29th Assembly District
District
Candidates
| Assembly District 29 Candidates on the Primary Ballot | ||
| Incumbent: Treig E. Pronschinske | ||
Jan 1 thru July 30
|
||
|---|---|---|
| receipts | disbursements | |
| Republican | ||
| Treig Pronschinske | $5,025.00 | $19,318.57 |
| Democratic | ||
| Chris Danou | $2,150.00 | $0.00 |
| Data from the 2026 July Continuing Report. Any amended reports might not yet be shown. | ||
Past election results
| Election Results in Wisconsin State Assembly District 29 | ||||||
votes
|
Dem. %1 |
margin (Dem. - Rep.)
|
||||
|---|---|---|---|---|---|---|
| total | Dem. | Rep. | votes | points2 | ||
| 2016 President | 28,923 | 10,544 | 16,665 | 38.8% | −6,121 | −22.5 |
| 2016 Senator | 28,487 | 11,307 | 16,096 | 41.3% | −4,789 | −17.5 |
| 2018 Governor | 24,424 | 10,090 | 13,742 | 42.3% | −3,652 | −15.3 |
| 2018 Senator | 24,281 | 12,146 | 12,126 | 50.0% | +20 | +0.1 |
| 2020 President | 32,563 | 12,126 | 19,768 | 38.0% | −7,642 | −24.0 |
| 2022 Governor | 25,249 | 9,895 | 14,948 | 39.8% | −5,053 | −20.3 |
| 2022 Senator | 25,201 | 9,235 | 15,937 | 36.7% | −6,702 | −26.6 |
| 2024 President | 34,124 | 11,981 | 21,475 | 35.8% | −9,494 | −28.4 |
| 2024 Senator | 33,778 | 12,486 | 20,463 | 37.9% | −7,977 | −24.2 |
| 2024 WI Assembly | 33,314 | 11,675 | 21,619 | 35.1% | −9,944 | −29.9 |
| 2025 WI Sup. Ct.3 | 22,560 | 9,659 | 12,846 | 42.9% | −3,187 | −14.2 |
| 1 Share of the two-party vote. For Rep. share, subtract from 100. | ||||||
| 2 Dem % of the two-party vote minus Rep % of the two-party vote | ||||||
| 3 Formally nonpartisan candidates assigned party labels based on state endorsements | ||||||
| Election results allocated into 2024 district boundaries based on population overlap. Calculations by John Johnson (johndjohnson.info). | ||||||
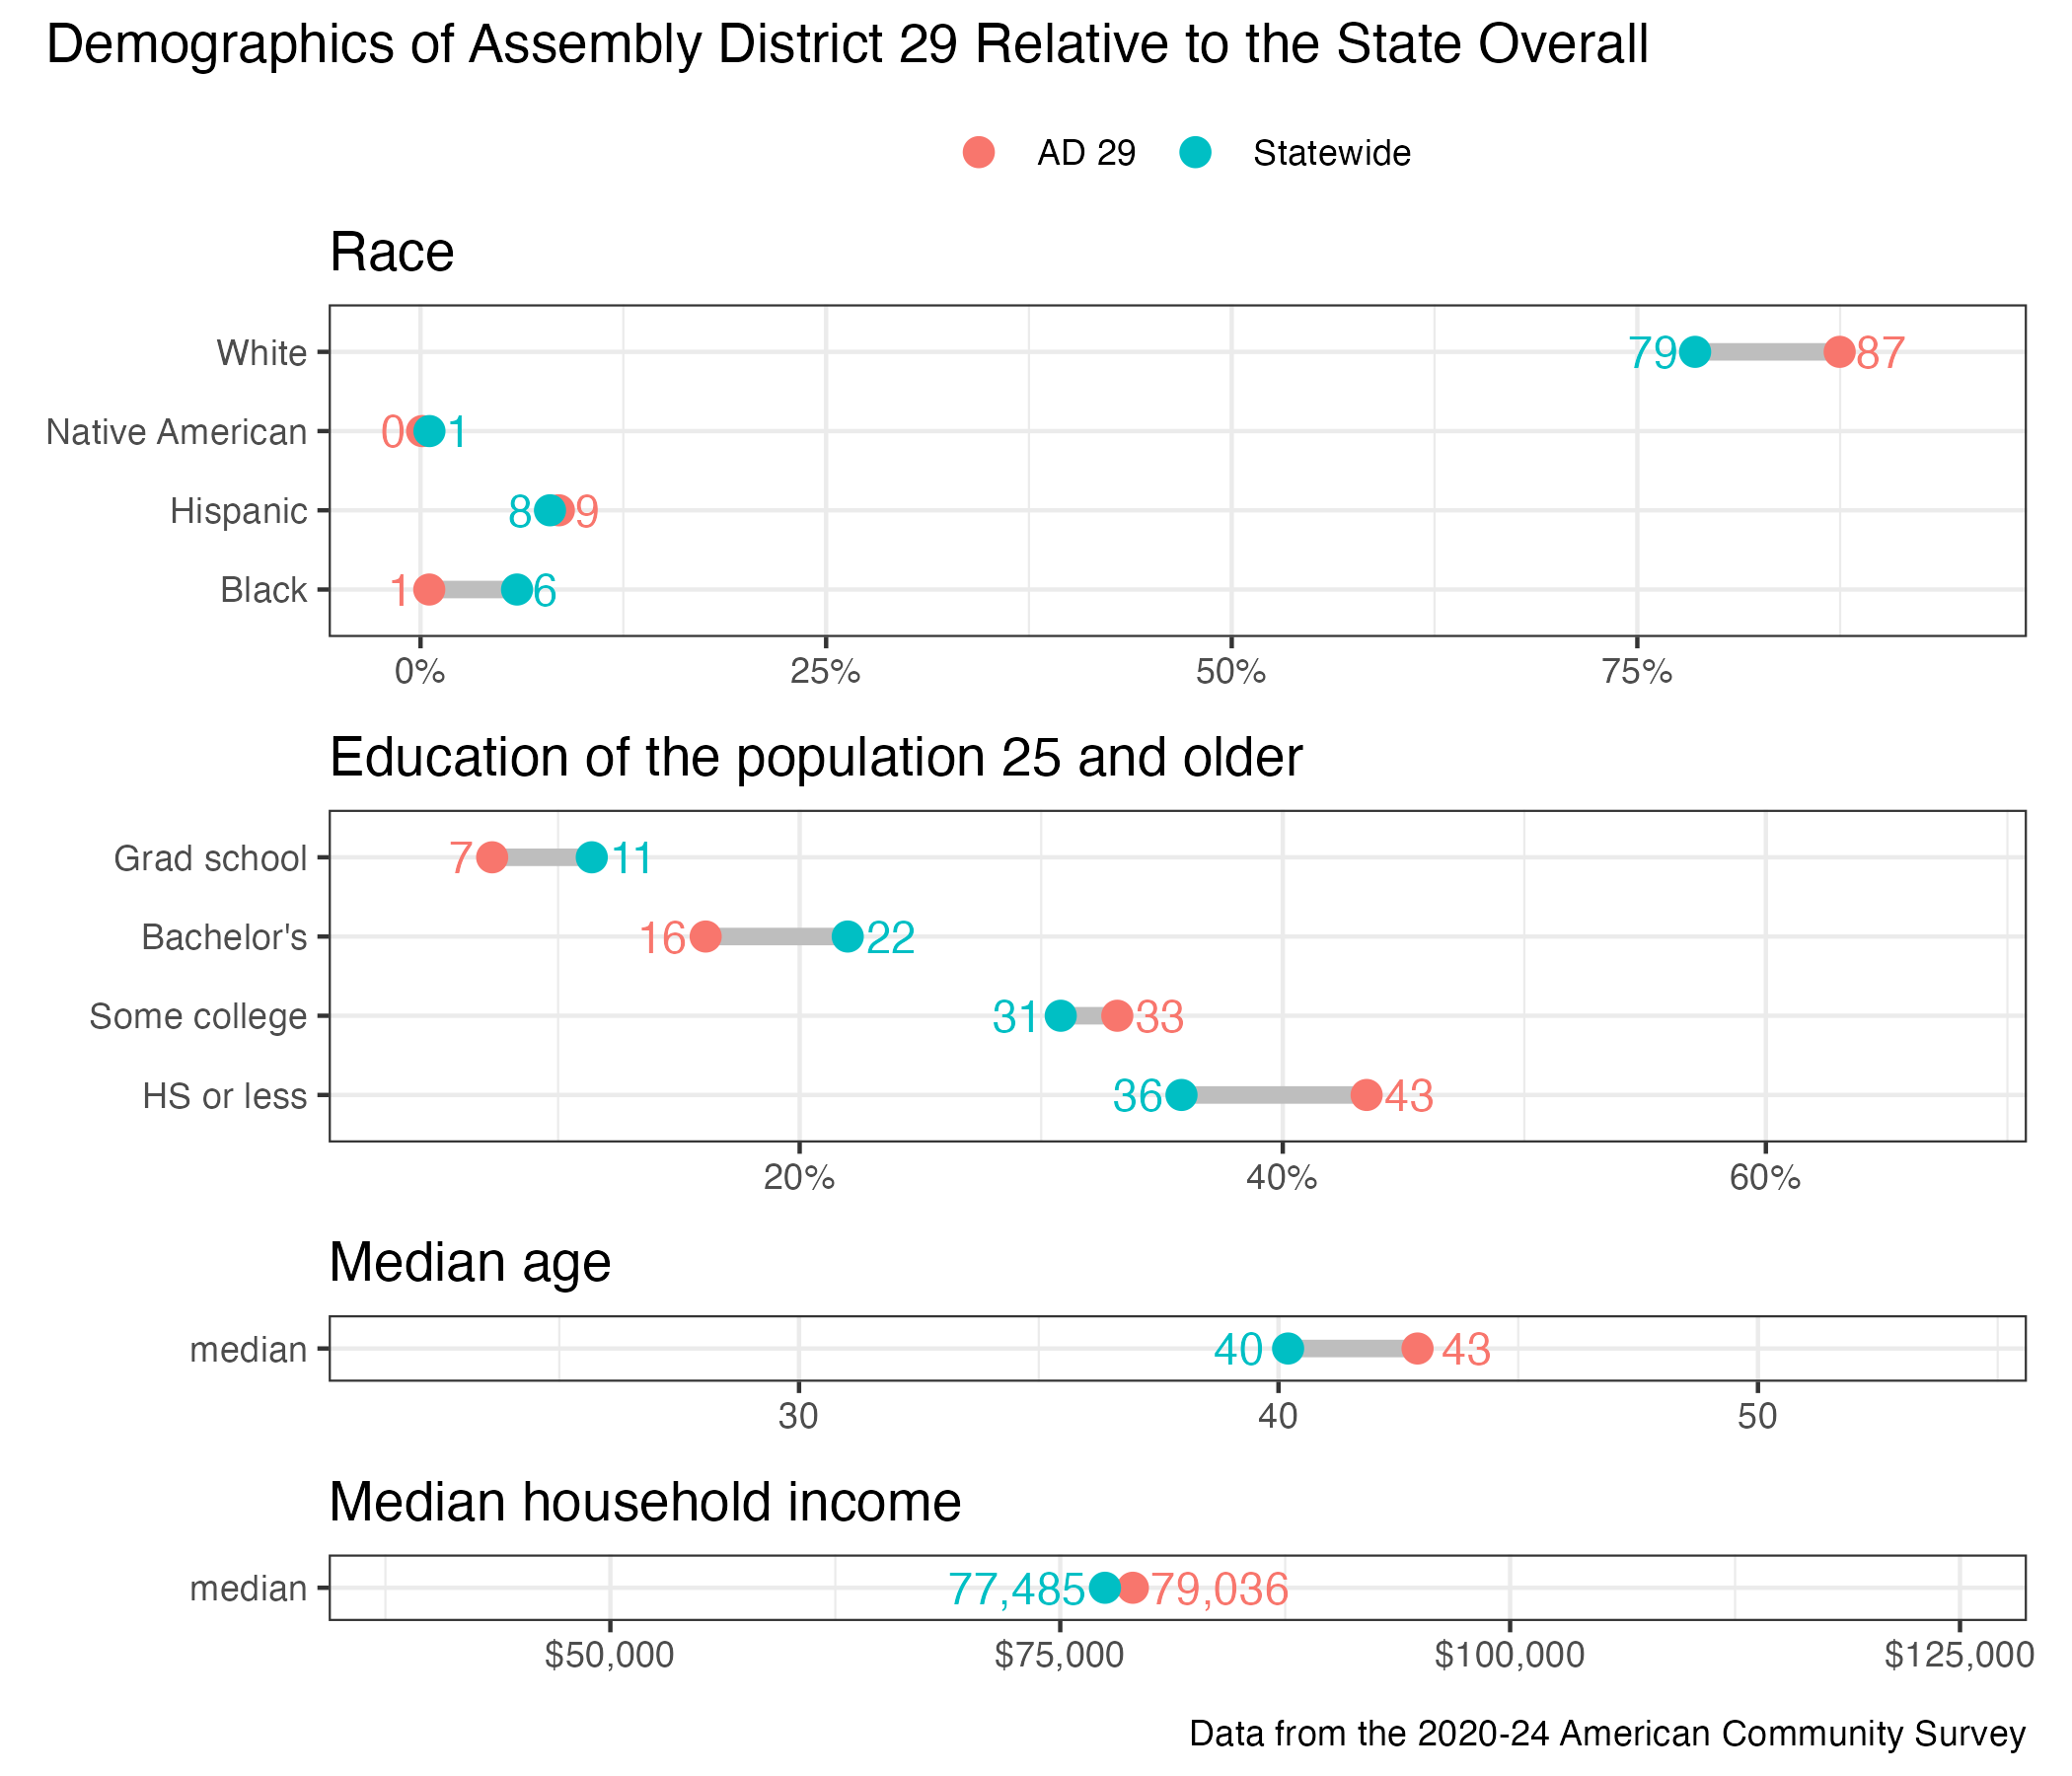
District demographics