29th Senate District
District
Candidates
| Senate District 29 Candidates on the Primary Ballot | ||
| Incumbent: Cory Tomczyk | ||
Jan 1 thru July 30
|
||
|---|---|---|
| receipts | disbursements | |
| Republican | ||
| Cory Tomczyk | $35,360.00 | $41,396.90 |
| Democratic | ||
| Gillian Battino | $62,297.55 | $21,028.13 |
| Data from the 2026 July Continuing Report. Any amended reports might not yet be shown. | ||
Past election results
| Election Results in Wisconsin State Senate District 29 | ||||||
votes
|
Dem. %1 |
margin (Dem. - Rep.)
|
||||
|---|---|---|---|---|---|---|
| total | Dem. | Rep. | votes | points2 | ||
| 2016 President | 90,938 | 34,777 | 50,931 | 40.6% | −16,154 | −18.8 |
| 2016 Senator | 90,251 | 36,414 | 50,468 | 41.9% | −14,054 | −16.2 |
| 2018 Governor | 80,995 | 31,954 | 47,498 | 40.2% | −15,544 | −19.6 |
| 2018 Senator | 80,589 | 38,274 | 42,243 | 47.5% | −3,969 | −4.9 |
| 2020 President | 100,439 | 40,222 | 58,543 | 40.7% | −18,321 | −18.6 |
| 2022 Governor | 80,578 | 33,062 | 46,495 | 41.6% | −13,433 | −16.9 |
| 2022 Senator | 80,378 | 31,476 | 48,769 | 39.2% | −17,293 | −21.6 |
| 2024 President | 102,883 | 40,812 | 60,641 | 40.2% | −19,829 | −19.5 |
| 2024 Senator | 102,176 | 41,543 | 58,366 | 41.6% | −16,823 | −16.8 |
| 2024 NA | NA | NA | NA | NA | NA | NA |
| 2025 WI Sup. Ct.3 | 70,202 | 31,469 | 38,692 | 44.9% | −7,223 | −10.3 |
| 1 Share of the two-party vote. For Rep. share, subtract from 100. | ||||||
| 2 Dem % of the two-party vote minus Rep % of the two-party vote | ||||||
| 3 Formally nonpartisan candidates assigned party labels based on state endorsements | ||||||
| Election results allocated into 2024 district boundaries based on population overlap. Calculations by John Johnson (johndjohnson.info). | ||||||
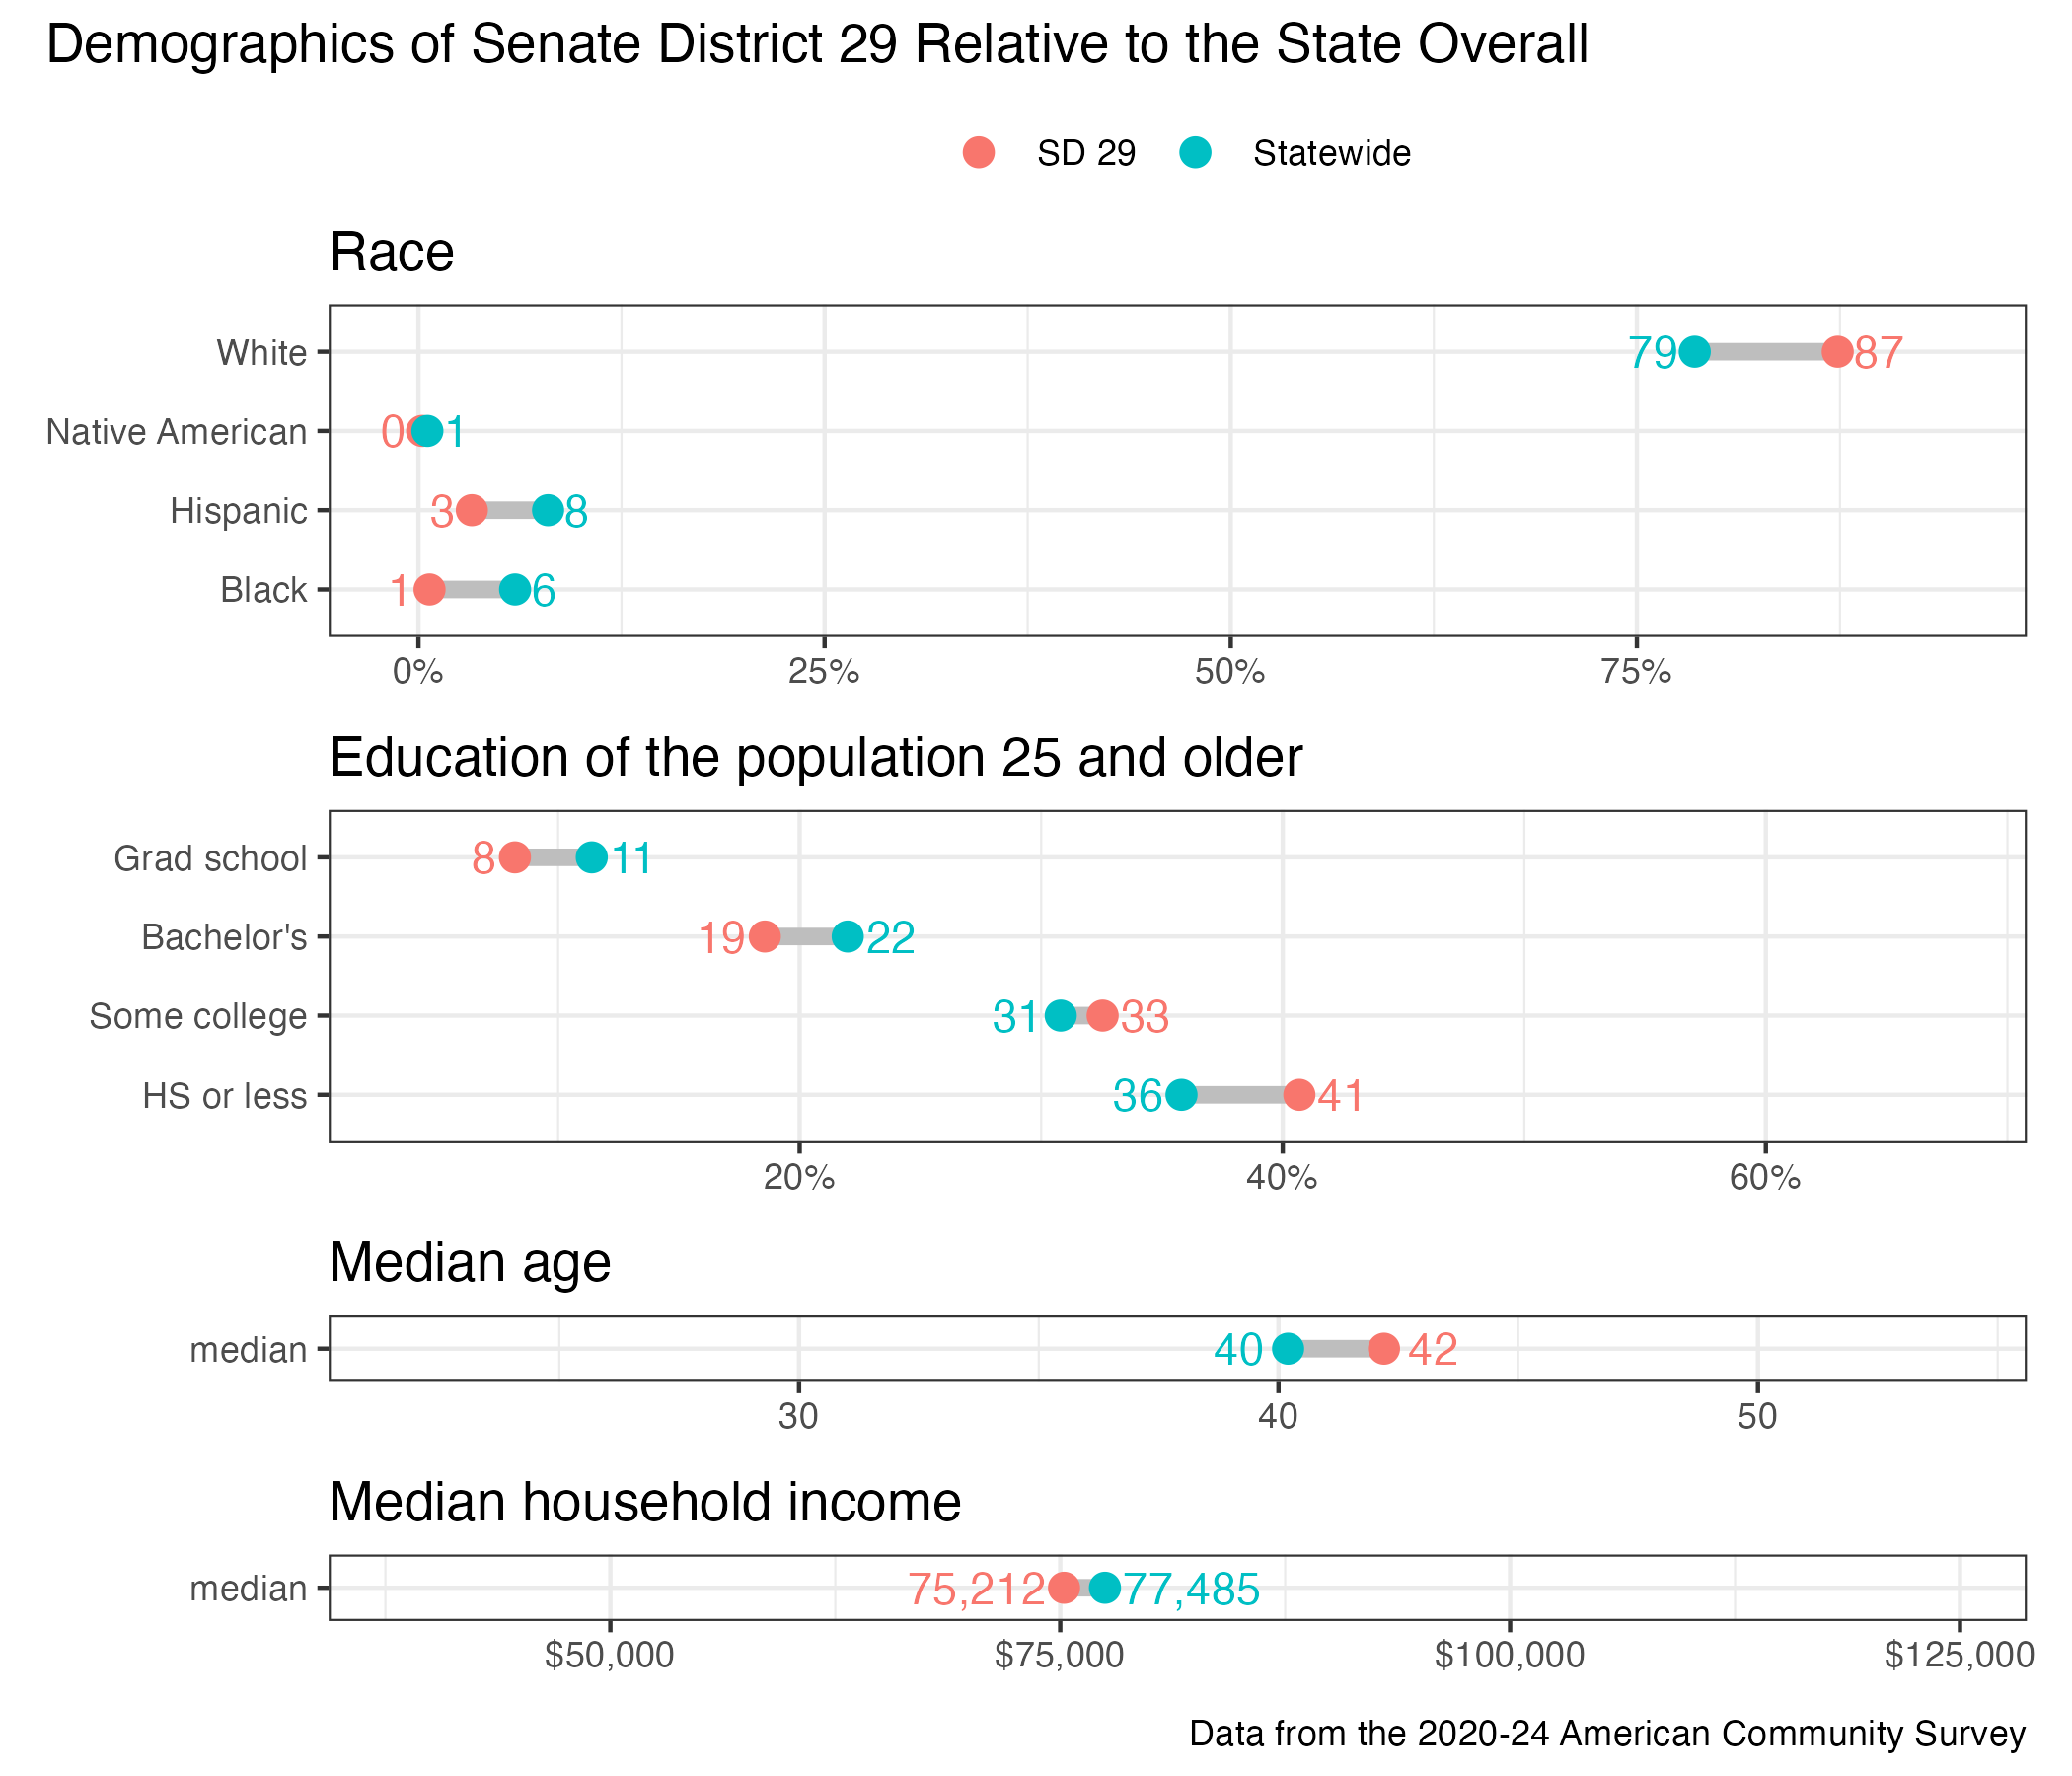
District demographics