15th Senate District
District
Candidates
| Senate District 15 Candidates on the Primary Ballot | ||
| Incumbent: Mark Spreitzer | ||
Jan 1 thru July 30
|
||
|---|---|---|
| receipts | disbursements | |
| Serving People Not Parties | ||
| Christopher Dean | $712.56 | $346.68 |
| Republican | ||
| Scott Fleming | $1,747.02 | $0.00 |
| Democratic | ||
| Mark Spreitzer | $38,304.38 | $29,901.32 |
| Data from the 2026 July Continuing Report. Any amended reports might not yet be shown. | ||
Past election results
| Election Results in Wisconsin State Senate District 15 | ||||||
votes
|
Dem. %1 |
margin (Dem. - Rep.)
|
||||
|---|---|---|---|---|---|---|
| total | Dem. | Rep. | votes | points2 | ||
| 2016 President | 83,513 | 43,173 | 34,405 | 55.7% | +8,768 | +11.3 |
| 2016 Senator | 82,552 | 46,043 | 33,825 | 57.6% | +12,218 | +15.3 |
| 2018 Governor | 73,949 | 42,986 | 29,068 | 59.7% | +13,918 | +19.3 |
| 2018 Senator | 73,570 | 46,125 | 27,361 | 62.8% | +18,764 | +25.5 |
| 2020 President | 90,843 | 49,922 | 39,262 | 56.0% | +10,660 | +12.0 |
| 2022 Governor | 70,056 | 40,719 | 28,479 | 58.8% | +12,240 | +17.7 |
| 2022 Senator | 69,756 | 38,930 | 30,655 | 55.9% | +8,275 | +11.9 |
| 2024 President | 94,331 | 50,042 | 42,763 | 53.9% | +7,279 | +7.8 |
| 2024 Senator | 93,347 | 50,442 | 40,539 | 55.4% | +9,903 | +10.9 |
| 2024 NA | NA | NA | NA | NA | NA | NA |
| 2025 WI Sup. Ct.3 | 61,864 | 38,056 | 23,755 | 61.6% | +14,301 | +23.1 |
| 1 Share of the two-party vote. For Rep. share, subtract from 100. | ||||||
| 2 Dem % of the two-party vote minus Rep % of the two-party vote | ||||||
| 3 Formally nonpartisan candidates assigned party labels based on state endorsements | ||||||
| Election results allocated into 2024 district boundaries based on population overlap. Calculations by John Johnson (johndjohnson.info). | ||||||
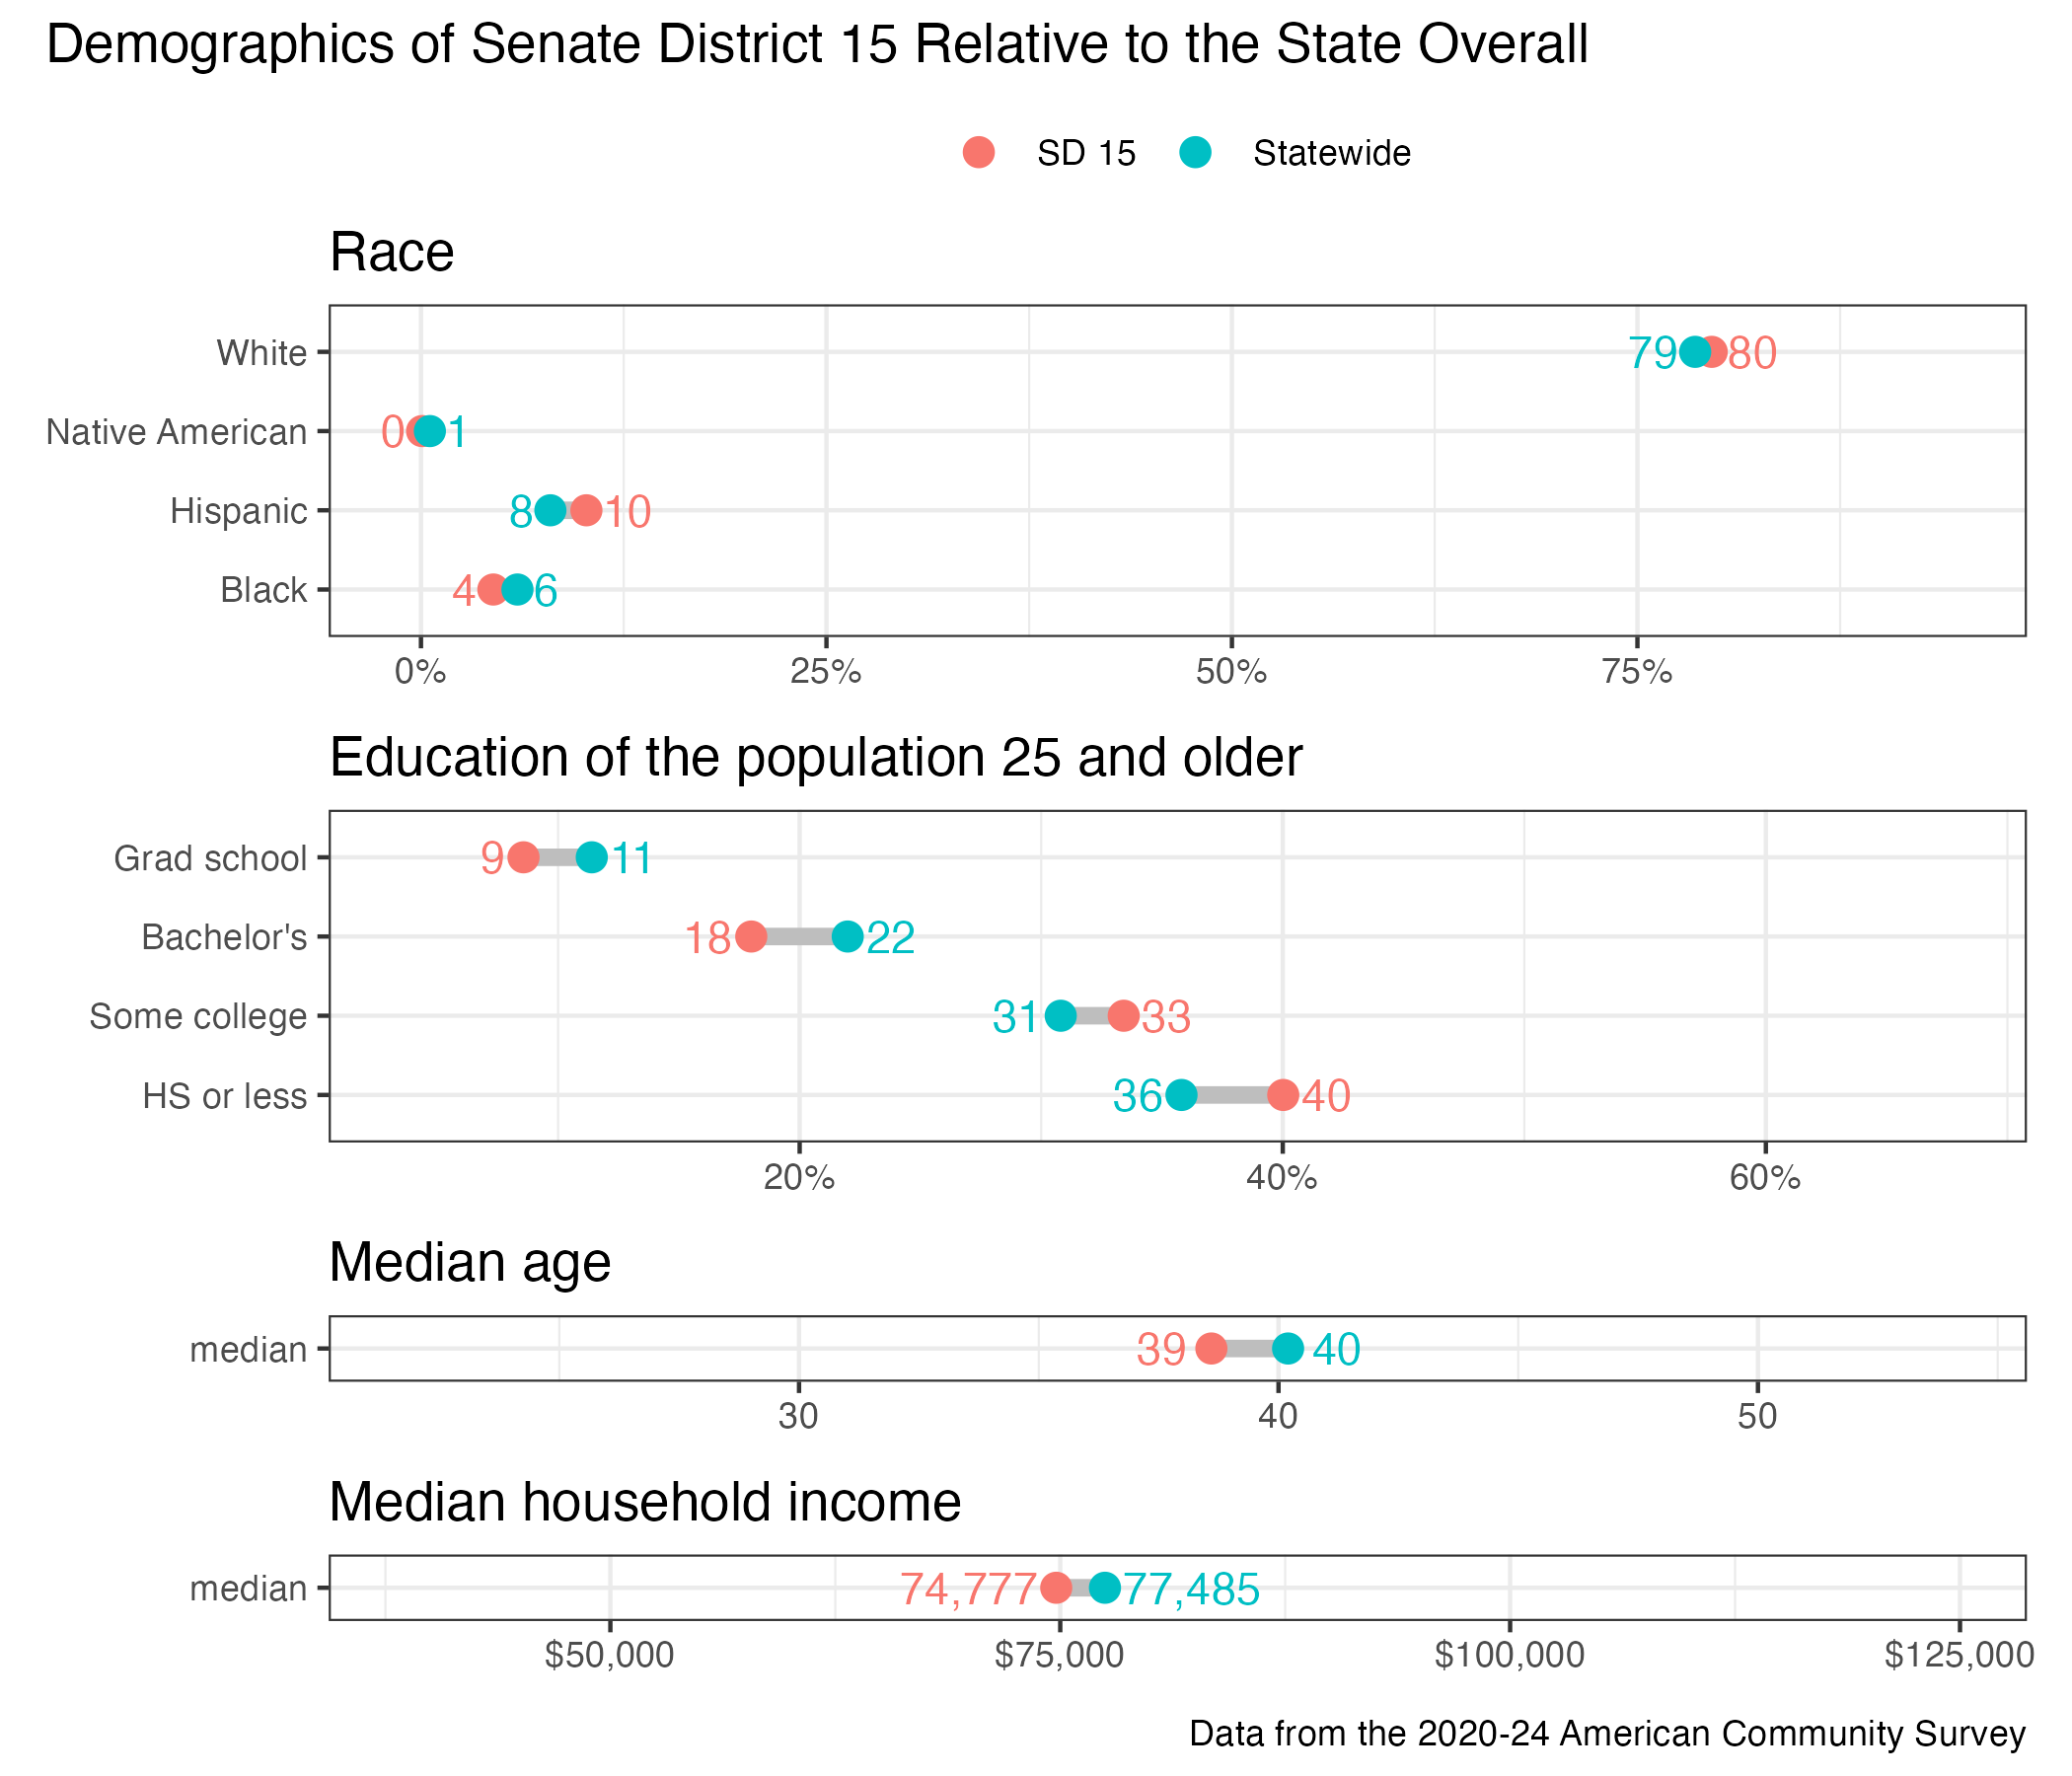
District demographics