31st Senate District
District
Candidates
| Senate District 31 Candidates on the Primary Ballot | ||
| Incumbent: Jeff Smith | ||
Jan 1 thru July 30
|
||
|---|---|---|
| receipts | disbursements | |
| Republican | ||
| Michele Magadance Skinner | $120,460.60 | $958.17 |
| Democratic | ||
| Jeff Smith | $163,043.84 | $16,981.04 |
| Data from the 2026 July Continuing Report. Any amended reports might not yet be shown. | ||
Past election results
| Election Results in Wisconsin State Senate District 31 | ||||||
votes
|
Dem. %1 |
margin (Dem. - Rep.)
|
||||
|---|---|---|---|---|---|---|
| total | Dem. | Rep. | votes | points2 | ||
| 2016 President | 89,567 | 42,334 | 40,507 | 51.1% | +1,827 | +2.2 |
| 2016 Senator | 88,336 | 43,150 | 41,771 | 50.8% | +1,379 | +1.6 |
| 2018 Governor | 78,561 | 41,149 | 35,415 | 53.7% | +5,734 | +7.5 |
| 2018 Senator | 78,219 | 46,013 | 32,130 | 58.9% | +13,883 | +17.8 |
| 2020 President | 95,978 | 48,552 | 45,341 | 51.7% | +3,211 | +3.4 |
| 2022 Governor | 78,458 | 42,366 | 35,144 | 54.7% | +7,222 | +9.3 |
| 2022 Senator | 77,622 | 39,992 | 37,481 | 51.6% | +2,511 | +3.2 |
| 2024 President | 104,240 | 52,455 | 50,186 | 51.1% | +2,269 | +2.2 |
| 2024 Senator | 103,012 | 52,710 | 47,891 | 52.4% | +4,819 | +4.8 |
| 2024 NA | NA | NA | NA | NA | NA | NA |
| 2025 WI Sup. Ct.3 | 71,257 | 42,031 | 29,181 | 59.0% | +12,850 | +18.0 |
| 1 Share of the two-party vote. For Rep. share, subtract from 100. | ||||||
| 2 Dem % of the two-party vote minus Rep % of the two-party vote | ||||||
| 3 Formally nonpartisan candidates assigned party labels based on state endorsements | ||||||
| Election results allocated into 2024 district boundaries based on population overlap. Calculations by John Johnson (johndjohnson.info). | ||||||
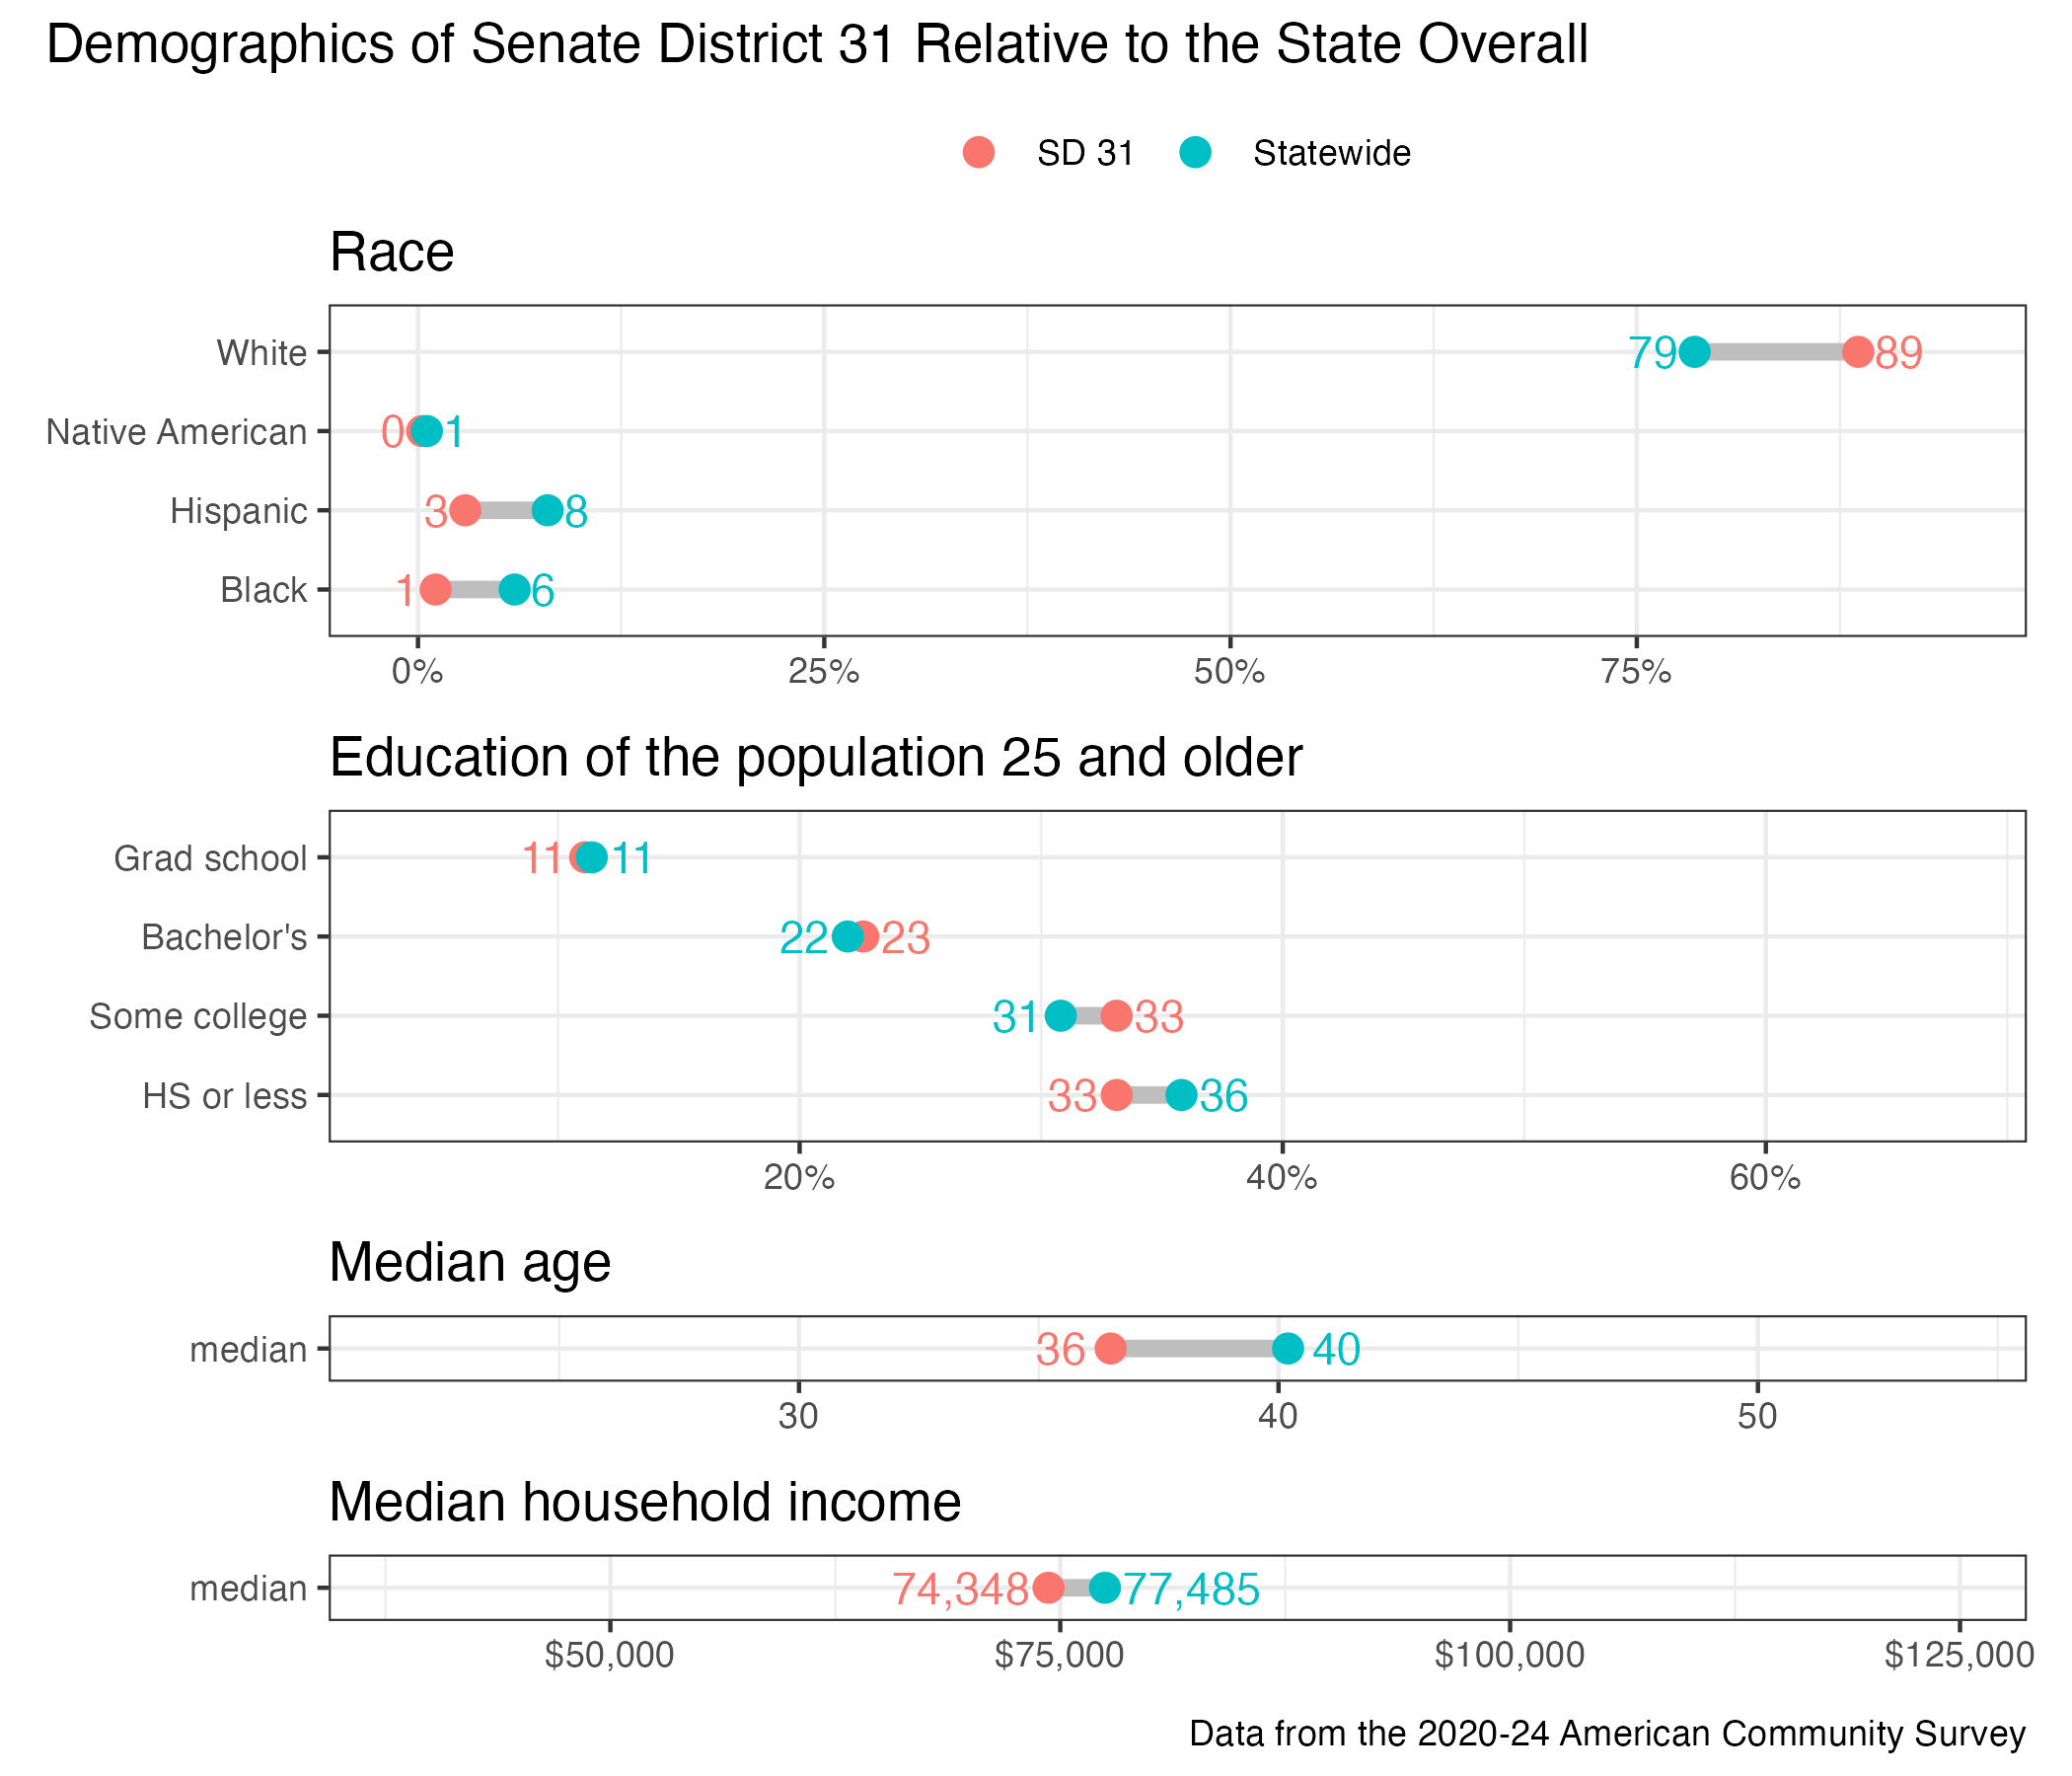
District demographics