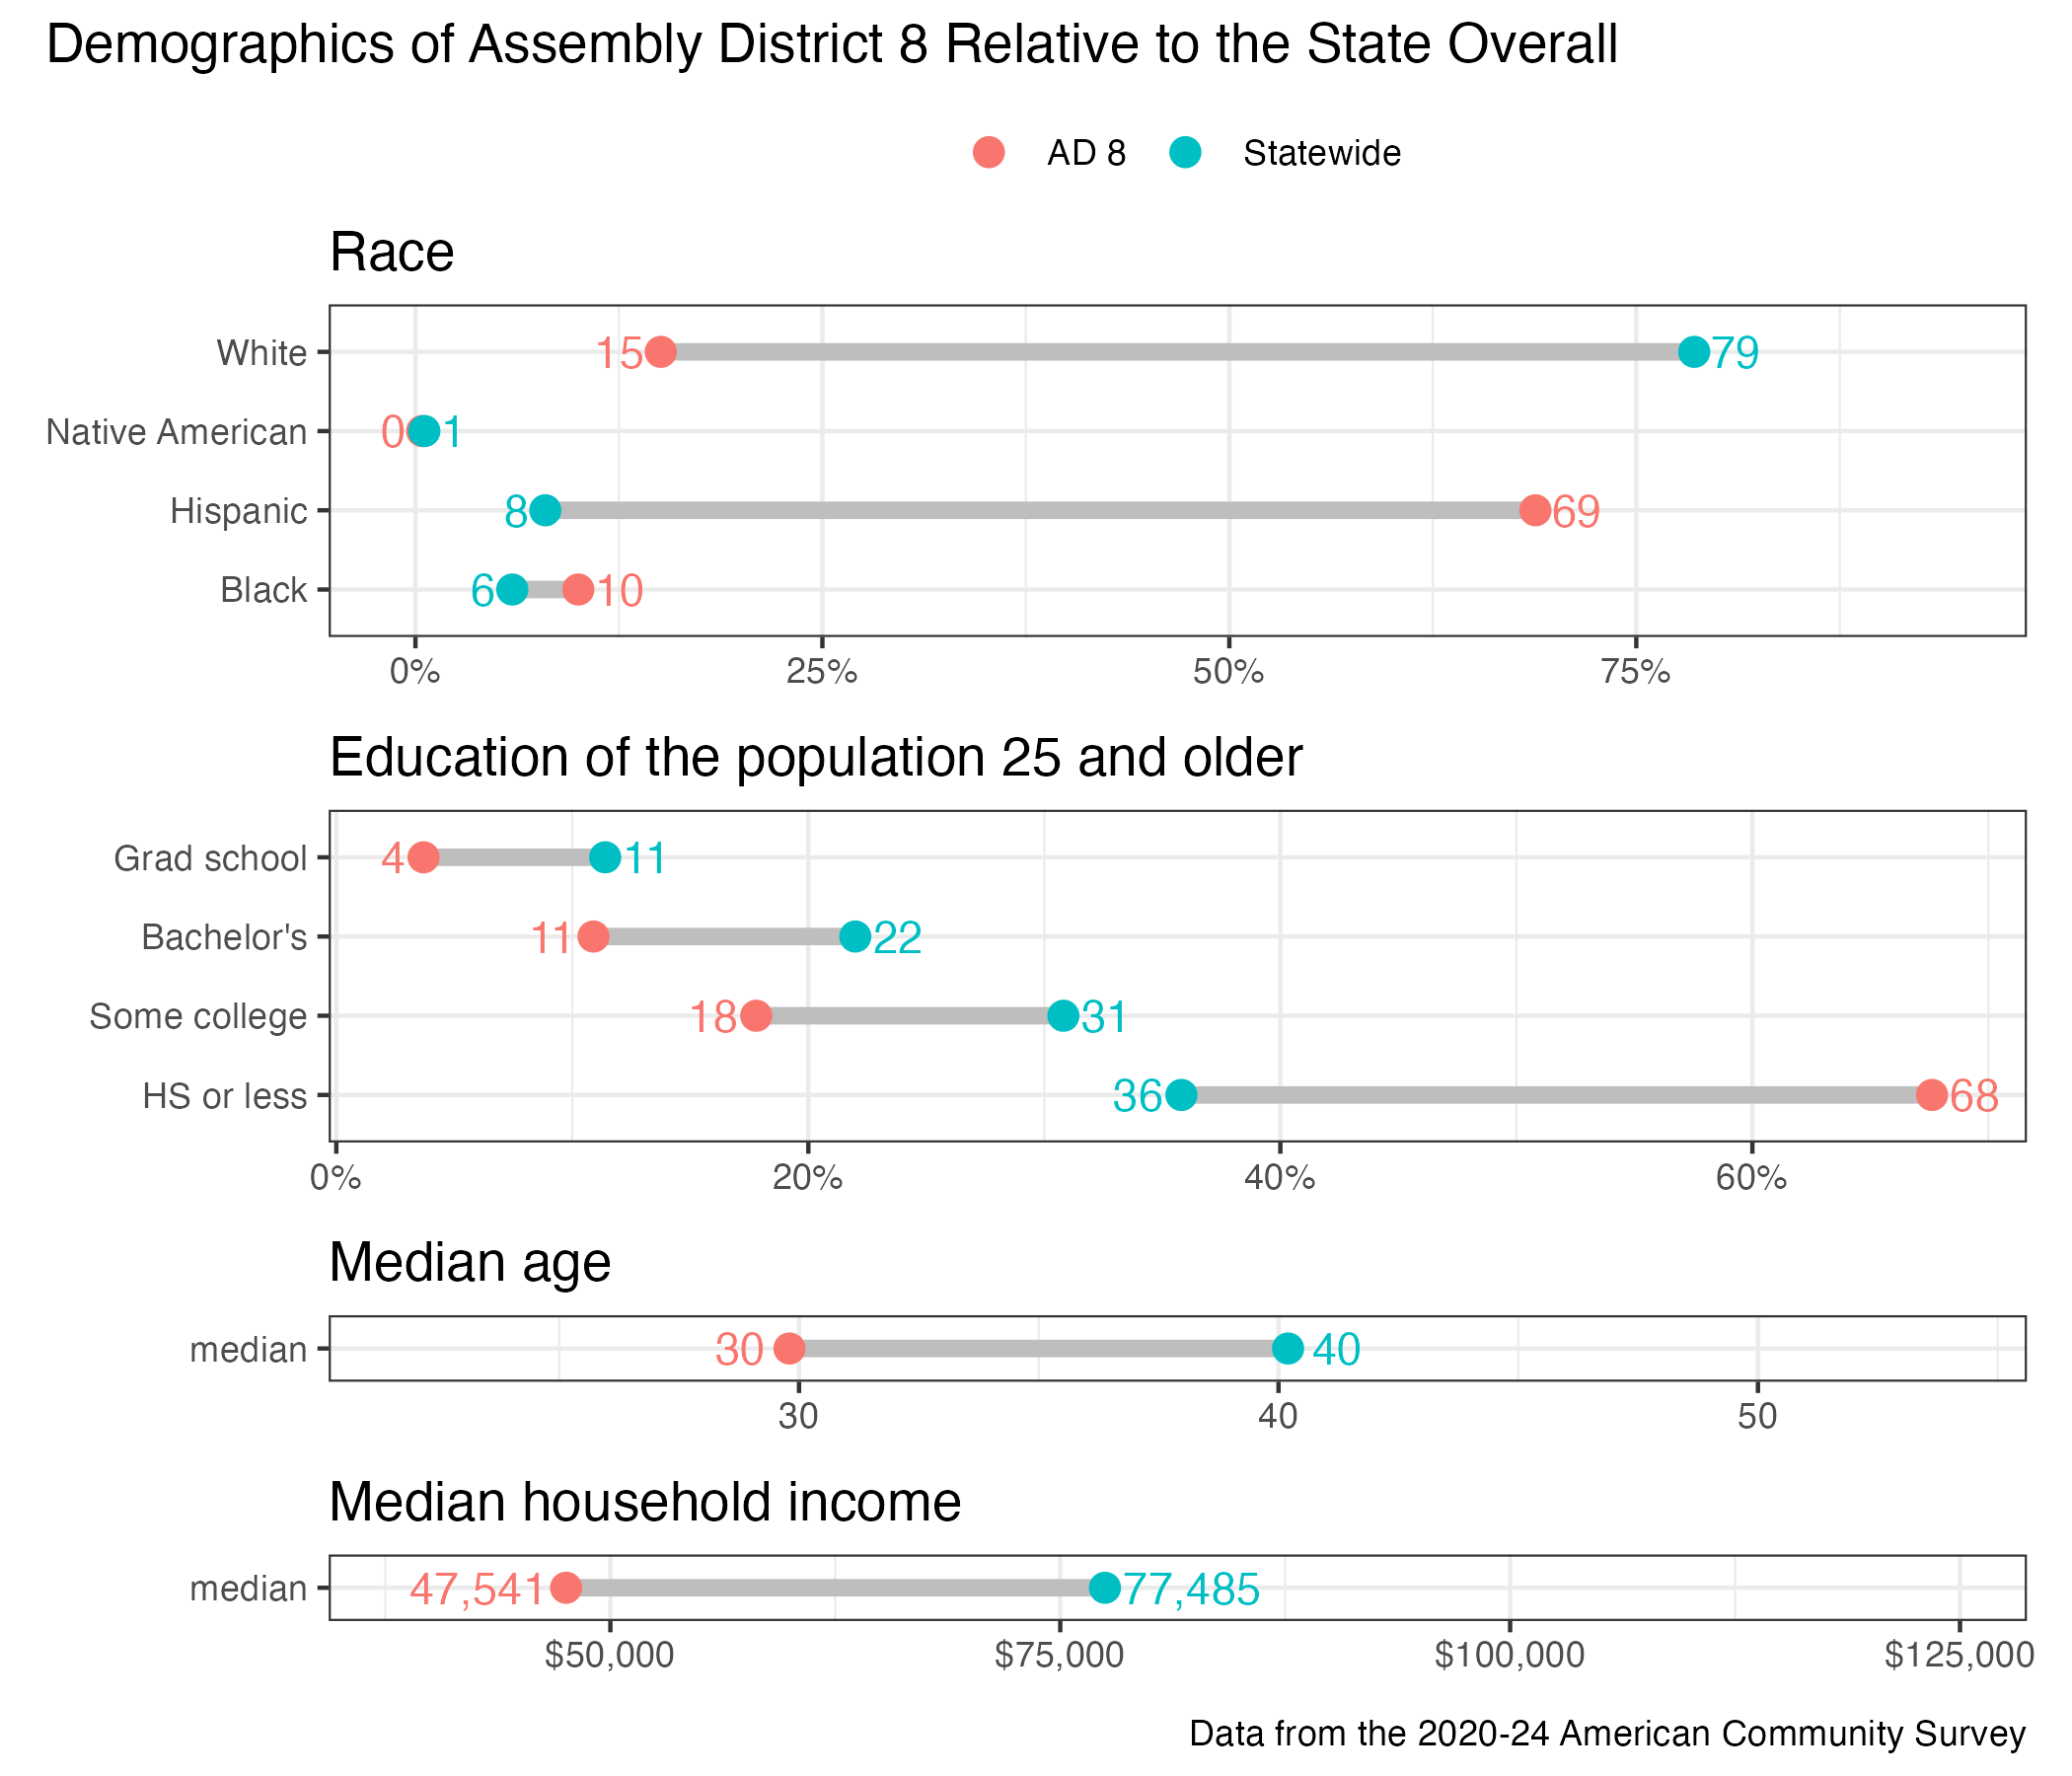
8th Assembly District
District
Candidates
| Assembly District 8 Candidates on the Primary Ballot | ||
| Incumbent: Sylvia Ortiz-Velez | ||
Jan 1 thru July 30
|
||
|---|---|---|
| receipts | disbursements | |
| Republican | ||
| Angel Sanchez | $300.00 | $12.00 |
| Democratic | ||
| Ismael Luna | $17,461.00 | $12,363.04 |
| Sylvia Ortiz-Velez | $5,928.00 | $9,017.88 |
| Data from the 2026 July Continuing Report. Any amended reports might not yet be shown. | ||
Past election results
| Election Results in Wisconsin State Assembly District 8 | ||||||
votes
|
Dem. %1 |
margin (Dem. - Rep.)
|
||||
|---|---|---|---|---|---|---|
| total | Dem. | Rep. | votes | points2 | ||
| 2016 President | 13,356 | 10,729 | 2,029 | 84.1% | +8,700 | +68.2 |
| 2016 Senator | 12,745 | 9,902 | 2,415 | 80.4% | +7,487 | +60.8 |
| 2018 Governor | 10,833 | 8,773 | 1,763 | 83.3% | +7,010 | +66.5 |
| 2018 Senator | 10,782 | 9,211 | 1,560 | 85.5% | +7,651 | +71.0 |
| 2020 President | 13,588 | 10,556 | 2,788 | 79.1% | +7,768 | +58.2 |
| 2022 Governor | 8,010 | 6,504 | 1,414 | 82.1% | +5,090 | +64.3 |
| 2022 Senator | 8,094 | 6,503 | 1,569 | 80.6% | +4,934 | +61.1 |
| 2024 President | 13,737 | 9,903 | 3,542 | 73.7% | +6,361 | +47.3 |
| 2024 Senator | 13,292 | 9,843 | 2,988 | 76.7% | +6,855 | +53.4 |
| 2024 WI Assembly | 11,215 | 10,987 | 0 | 100.0% | +10,987 | +100.0 |
| 2025 WI Sup. Ct.3 | 6,870 | 5,785 | 1,077 | 84.3% | +4,708 | +68.6 |
| 1 Share of the two-party vote. For Rep. share, subtract from 100. | ||||||
| 2 Dem % of the two-party vote minus Rep % of the two-party vote | ||||||
| 3 Formally nonpartisan candidates assigned party labels based on state endorsements | ||||||
| Election results allocated into 2024 district boundaries based on population overlap. Calculations by John Johnson (johndjohnson.info). | ||||||
District demographics