22nd Assembly District
District
Candidates
| Assembly District 22 Candidates on the Primary Ballot | ||
| Incumbent: Paul Melotik | ||
Jan 1 thru July 30
|
||
|---|---|---|
| receipts | disbursements | |
| Republican | ||
| Paul Melotik | $14,044.70 | $12,596.48 |
| Democratic | ||
| Dana Glasstein | $42,190.02 | $10,479.52 |
| Data from the 2026 July Continuing Report. Any amended reports might not yet be shown. | ||
Past election results
| Election Results in Wisconsin State Assembly District 22 | ||||||
votes
|
Dem. %1 |
margin (Dem. - Rep.)
|
||||
|---|---|---|---|---|---|---|
| total | Dem. | Rep. | votes | points2 | ||
| 2016 President | 34,917 | 12,973 | 19,372 | 40.1% | −6,399 | −19.8 |
| 2016 Senator | 35,008 | 11,690 | 22,587 | 34.1% | −10,897 | −31.8 |
| 2018 Governor | 33,199 | 12,026 | 20,678 | 36.8% | −8,652 | −26.5 |
| 2018 Senator | 33,075 | 14,039 | 18,998 | 42.5% | −4,959 | −15.0 |
| 2020 President | 39,883 | 17,382 | 21,818 | 44.3% | −4,436 | −11.3 |
| 2022 Governor | 34,597 | 15,416 | 18,887 | 44.9% | −3,471 | −10.1 |
| 2022 Senator | 34,545 | 14,640 | 19,817 | 42.5% | −5,177 | −15.0 |
| 2024 President | 41,726 | 18,454 | 22,596 | 45.0% | −4,142 | −10.1 |
| 2024 Senator | 41,500 | 17,977 | 22,899 | 44.0% | −4,922 | −12.0 |
| 2024 WI Assembly | 40,628 | 17,014 | 23,566 | 41.9% | −6,552 | −16.1 |
| 2025 WI Sup. Ct.3 | 31,598 | 15,356 | 16,225 | 48.6% | −869 | −2.8 |
| 1 Share of the two-party vote. For Rep. share, subtract from 100. | ||||||
| 2 Dem % of the two-party vote minus Rep % of the two-party vote | ||||||
| 3 Formally nonpartisan candidates assigned party labels based on state endorsements | ||||||
| Election results allocated into 2024 district boundaries based on population overlap. Calculations by John Johnson (johndjohnson.info). | ||||||
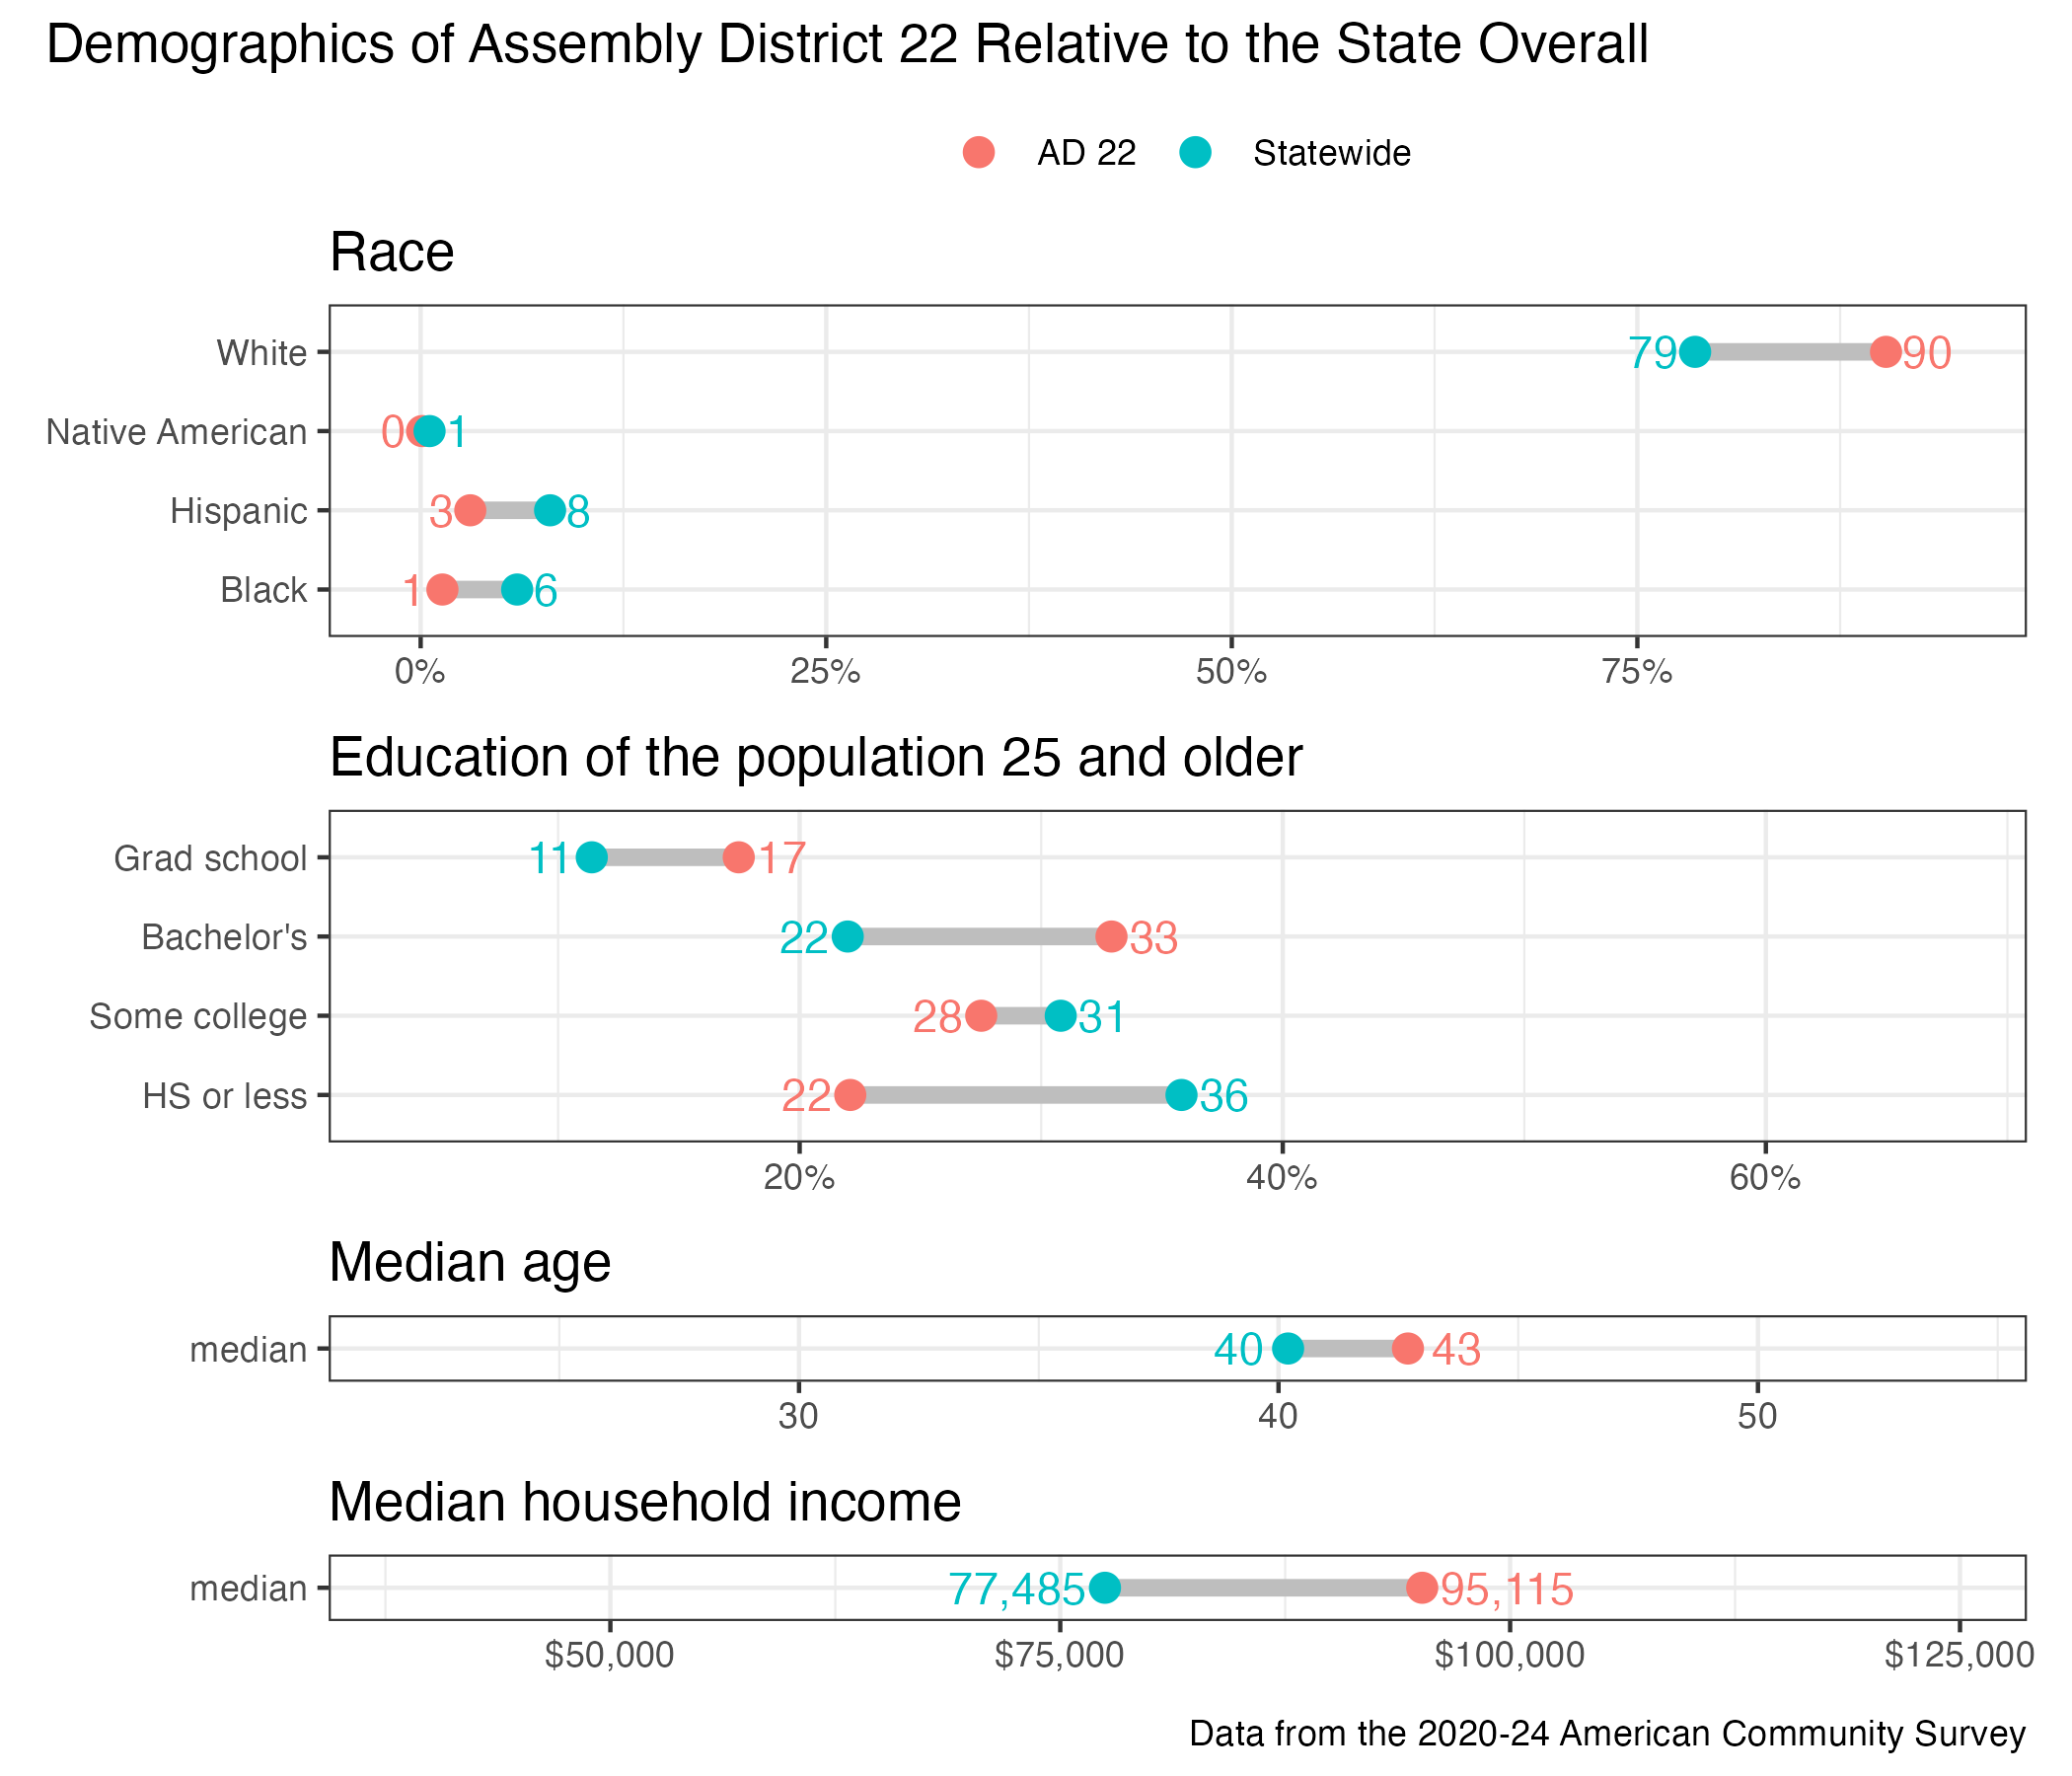
District demographics