1st Senate District
District
Candidates
| Senate District 1 Candidates on the Primary Ballot | ||
| Incumbent: André Jacque (Filed Notification of Noncandidacy) | ||
Jan 1 thru July 30
|
||
|---|---|---|
| receipts | disbursements | |
| Independent | ||
| Mark Becker | $20,233.41 | $5,154.55 |
| Republican | ||
| Nic Cravillion | $75,911.82 | $13,647.11 |
| Barbara Bittner | $17,180.00 | $2,738.48 |
| Jacob VandenPlas | $1,907.00 | $7,457.56 |
| Katie Baney | $46,772.08 | $3,109.11 |
| Data from the 2026 July Continuing Report. Any amended reports might not yet be shown. | ||
Past election results
| Election Results in Wisconsin State Senate District 1 | ||||||
votes
|
Dem. %1 |
margin (Dem. - Rep.)
|
||||
|---|---|---|---|---|---|---|
| total | Dem. | Rep. | votes | points2 | ||
| 2016 President | 94,493 | 34,918 | 54,064 | 39.2% | −19,146 | −21.5 |
| 2016 Senator | 94,127 | 33,907 | 56,951 | 37.3% | −23,044 | −25.4 |
| 2018 Governor | 85,232 | 33,545 | 50,268 | 40.0% | −16,723 | −20.0 |
| 2018 Senator | 84,808 | 39,914 | 44,851 | 47.1% | −4,937 | −5.8 |
| 2020 President | 108,317 | 42,479 | 64,128 | 39.8% | −21,649 | −20.3 |
| 2022 Governor | 89,807 | 36,474 | 52,342 | 41.1% | −15,868 | −17.9 |
| 2022 Senator | 89,662 | 34,663 | 54,878 | 38.7% | −20,215 | −22.6 |
| 2024 President | 114,756 | 44,924 | 68,197 | 39.7% | −23,273 | −20.6 |
| 2024 Senator | 113,949 | 45,047 | 66,397 | 40.4% | −21,350 | −19.2 |
| 2024 NA | NA | NA | NA | NA | NA | NA |
| 2025 WI Sup. Ct.3 | 78,559 | 35,200 | 43,322 | 44.8% | −8,122 | −10.3 |
| 1 Share of the two-party vote. For Rep. share, subtract from 100. | ||||||
| 2 Dem % of the two-party vote minus Rep % of the two-party vote | ||||||
| 3 Formally nonpartisan candidates assigned party labels based on state endorsements | ||||||
| Election results allocated into 2024 district boundaries based on population overlap. Calculations by John Johnson (johndjohnson.info). | ||||||
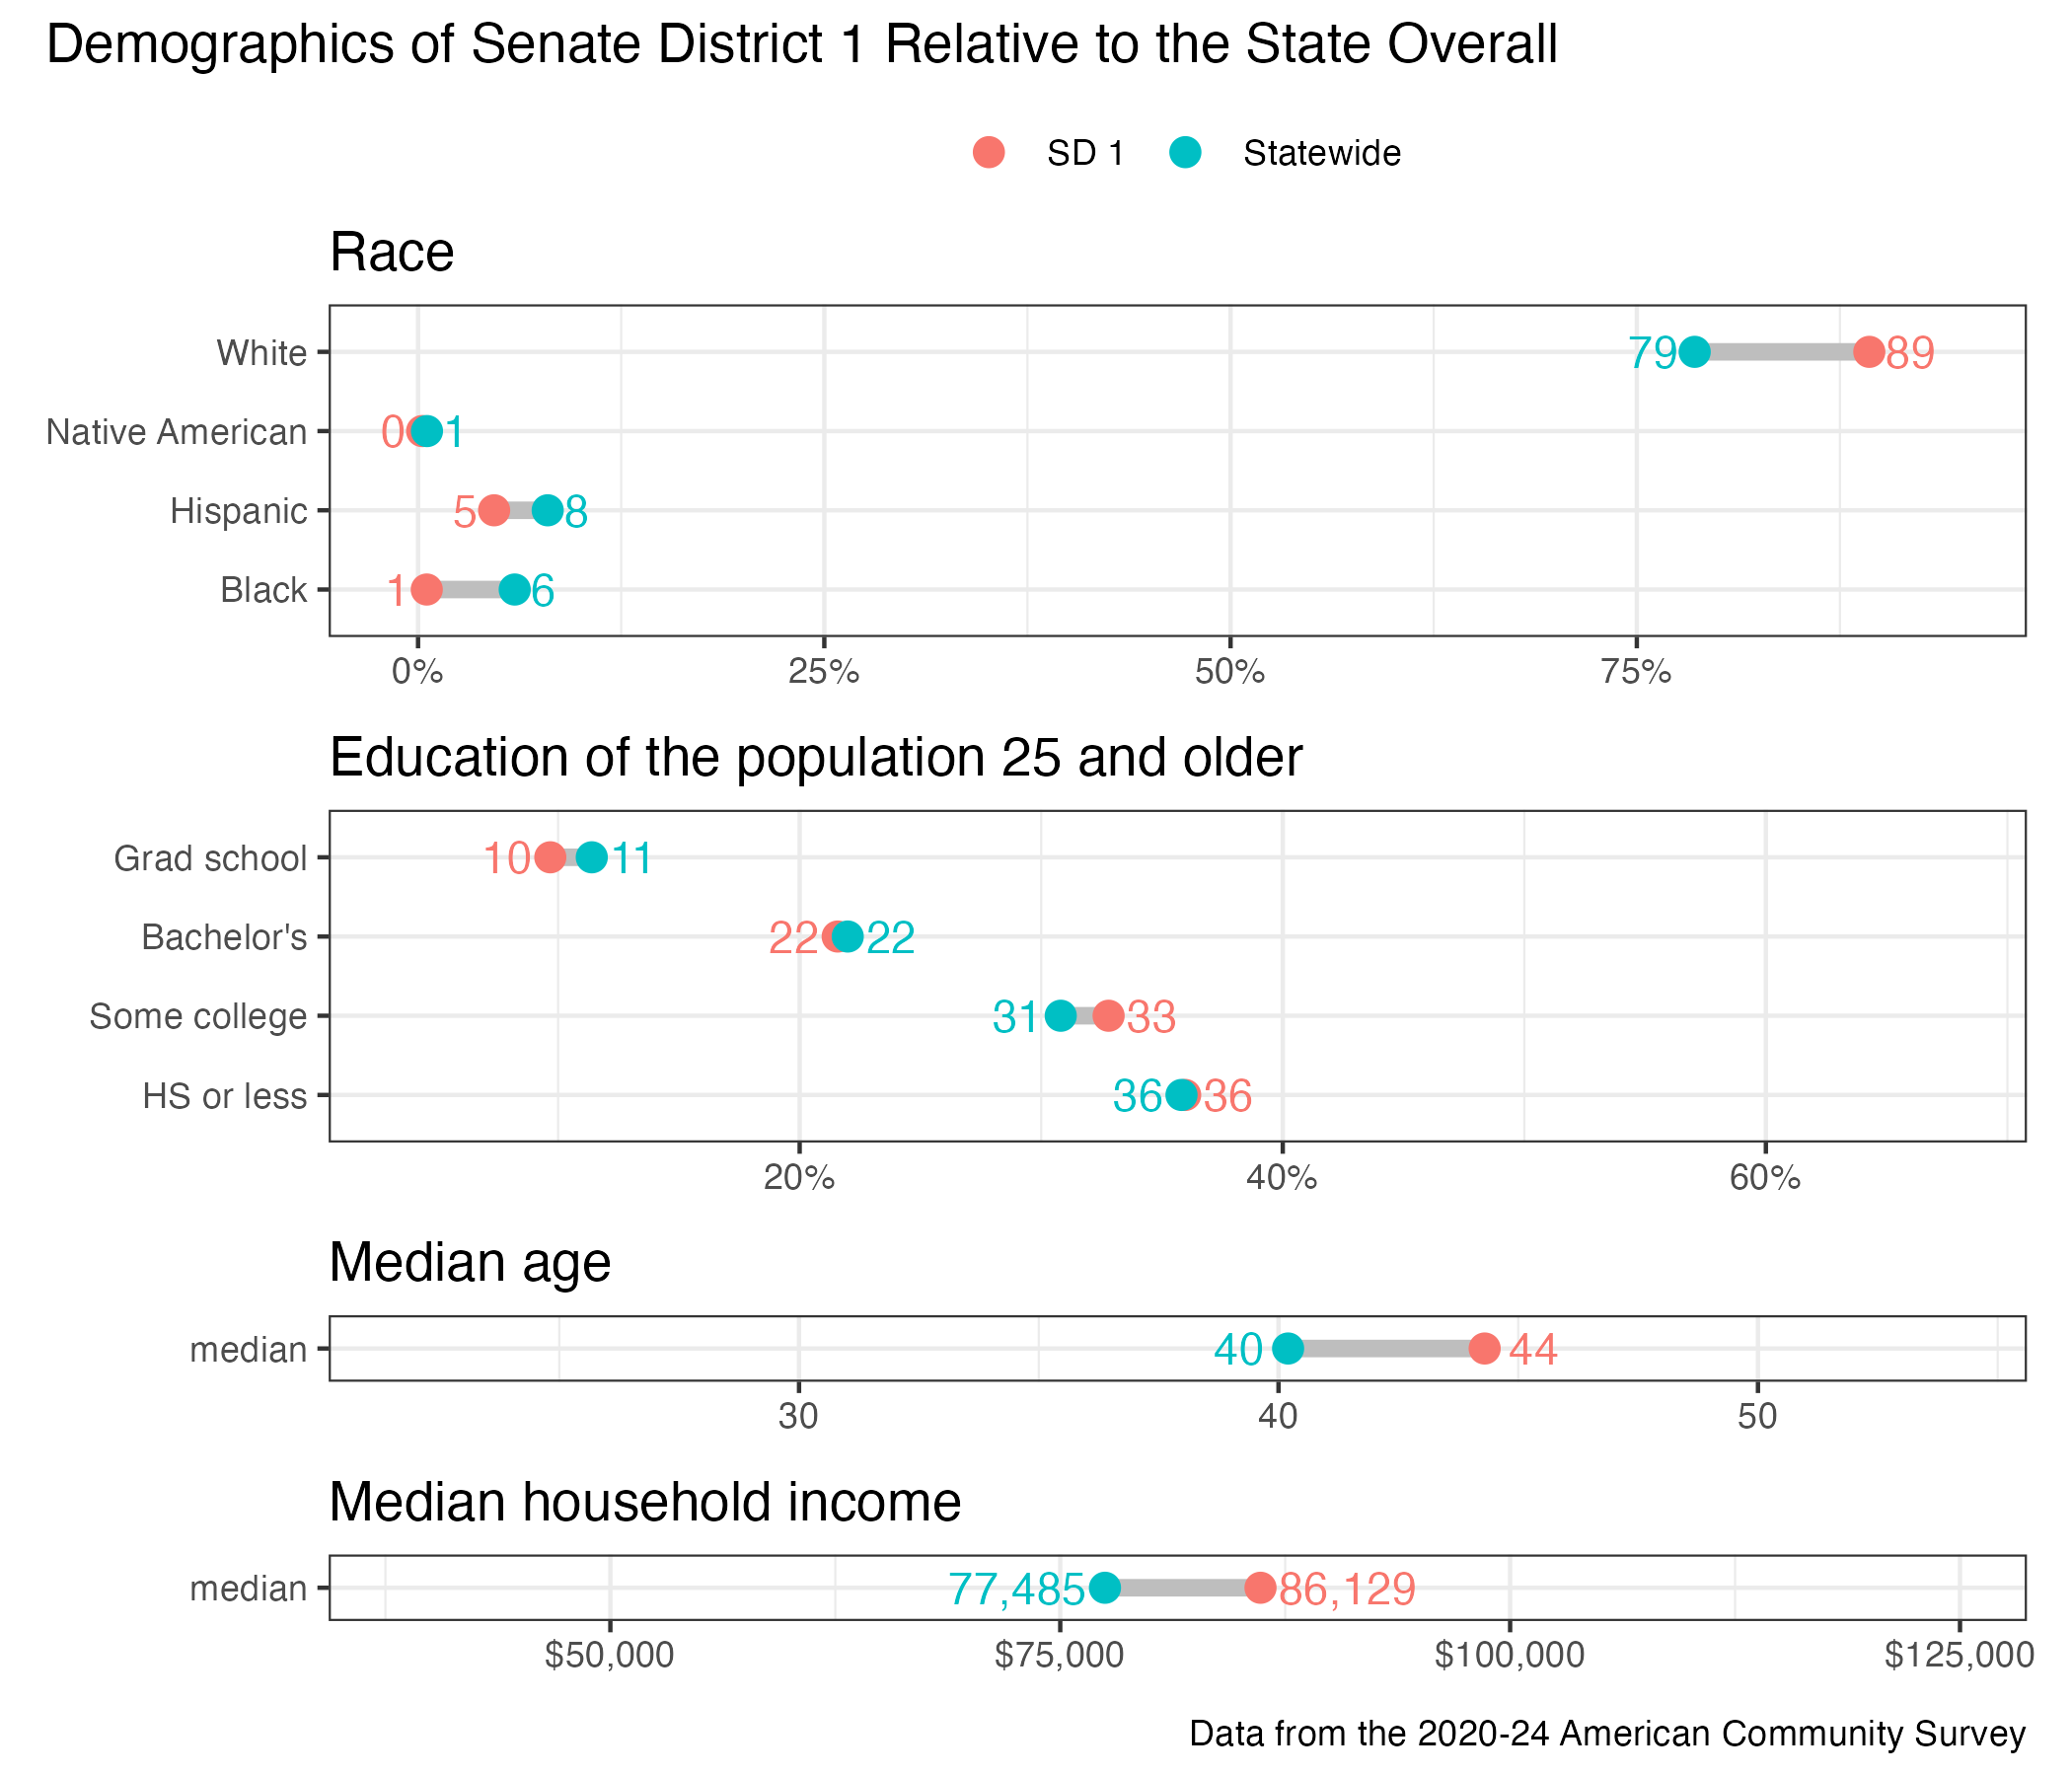
District demographics