3rd Senate District
District
Candidates
| Senate District 3 Candidates on the Primary Ballot | ||
| Incumbent: Tim Carpenter | ||
Jan 1 thru July 30
|
||
|---|---|---|
| receipts | disbursements | |
| Democratic | ||
| Tim Carpenter | $6,658.29 | $21,535.05 |
| Data from the 2026 July Continuing Report. Any amended reports might not yet be shown. | ||
Past election results
| Election Results in Wisconsin State Senate District 3 | ||||||
votes
|
Dem. %1 |
margin (Dem. - Rep.)
|
||||
|---|---|---|---|---|---|---|
| total | Dem. | Rep. | votes | points2 | ||
| 2016 President | 58,760 | 37,624 | 17,676 | 68.0% | +19,948 | +36.1 |
| 2016 Senator | 57,274 | 36,072 | 19,327 | 65.1% | +16,745 | +30.2 |
| 2018 Governor | 50,105 | 33,115 | 15,782 | 67.7% | +17,333 | +35.4 |
| 2018 Senator | 49,826 | 35,588 | 14,123 | 71.6% | +21,465 | +43.2 |
| 2020 President | 60,900 | 40,208 | 19,676 | 67.1% | +20,532 | +34.3 |
| 2022 Governor | 41,456 | 28,241 | 12,718 | 68.9% | +15,523 | +37.9 |
| 2022 Senator | 41,662 | 27,802 | 13,743 | 66.9% | +14,059 | +33.8 |
| 2024 President | 61,698 | 38,631 | 21,659 | 64.1% | +16,972 | +28.2 |
| 2024 Senator | 60,173 | 38,983 | 19,304 | 66.9% | +19,679 | +33.8 |
| 2024 NA | NA | NA | NA | NA | NA | NA |
| 2025 WI Sup. Ct.3 | 35,449 | 25,785 | 9,634 | 72.8% | +16,151 | +45.6 |
| 1 Share of the two-party vote. For Rep. share, subtract from 100. | ||||||
| 2 Dem % of the two-party vote minus Rep % of the two-party vote | ||||||
| 3 Formally nonpartisan candidates assigned party labels based on state endorsements | ||||||
| Election results allocated into 2024 district boundaries based on population overlap. Calculations by John Johnson (johndjohnson.info). | ||||||
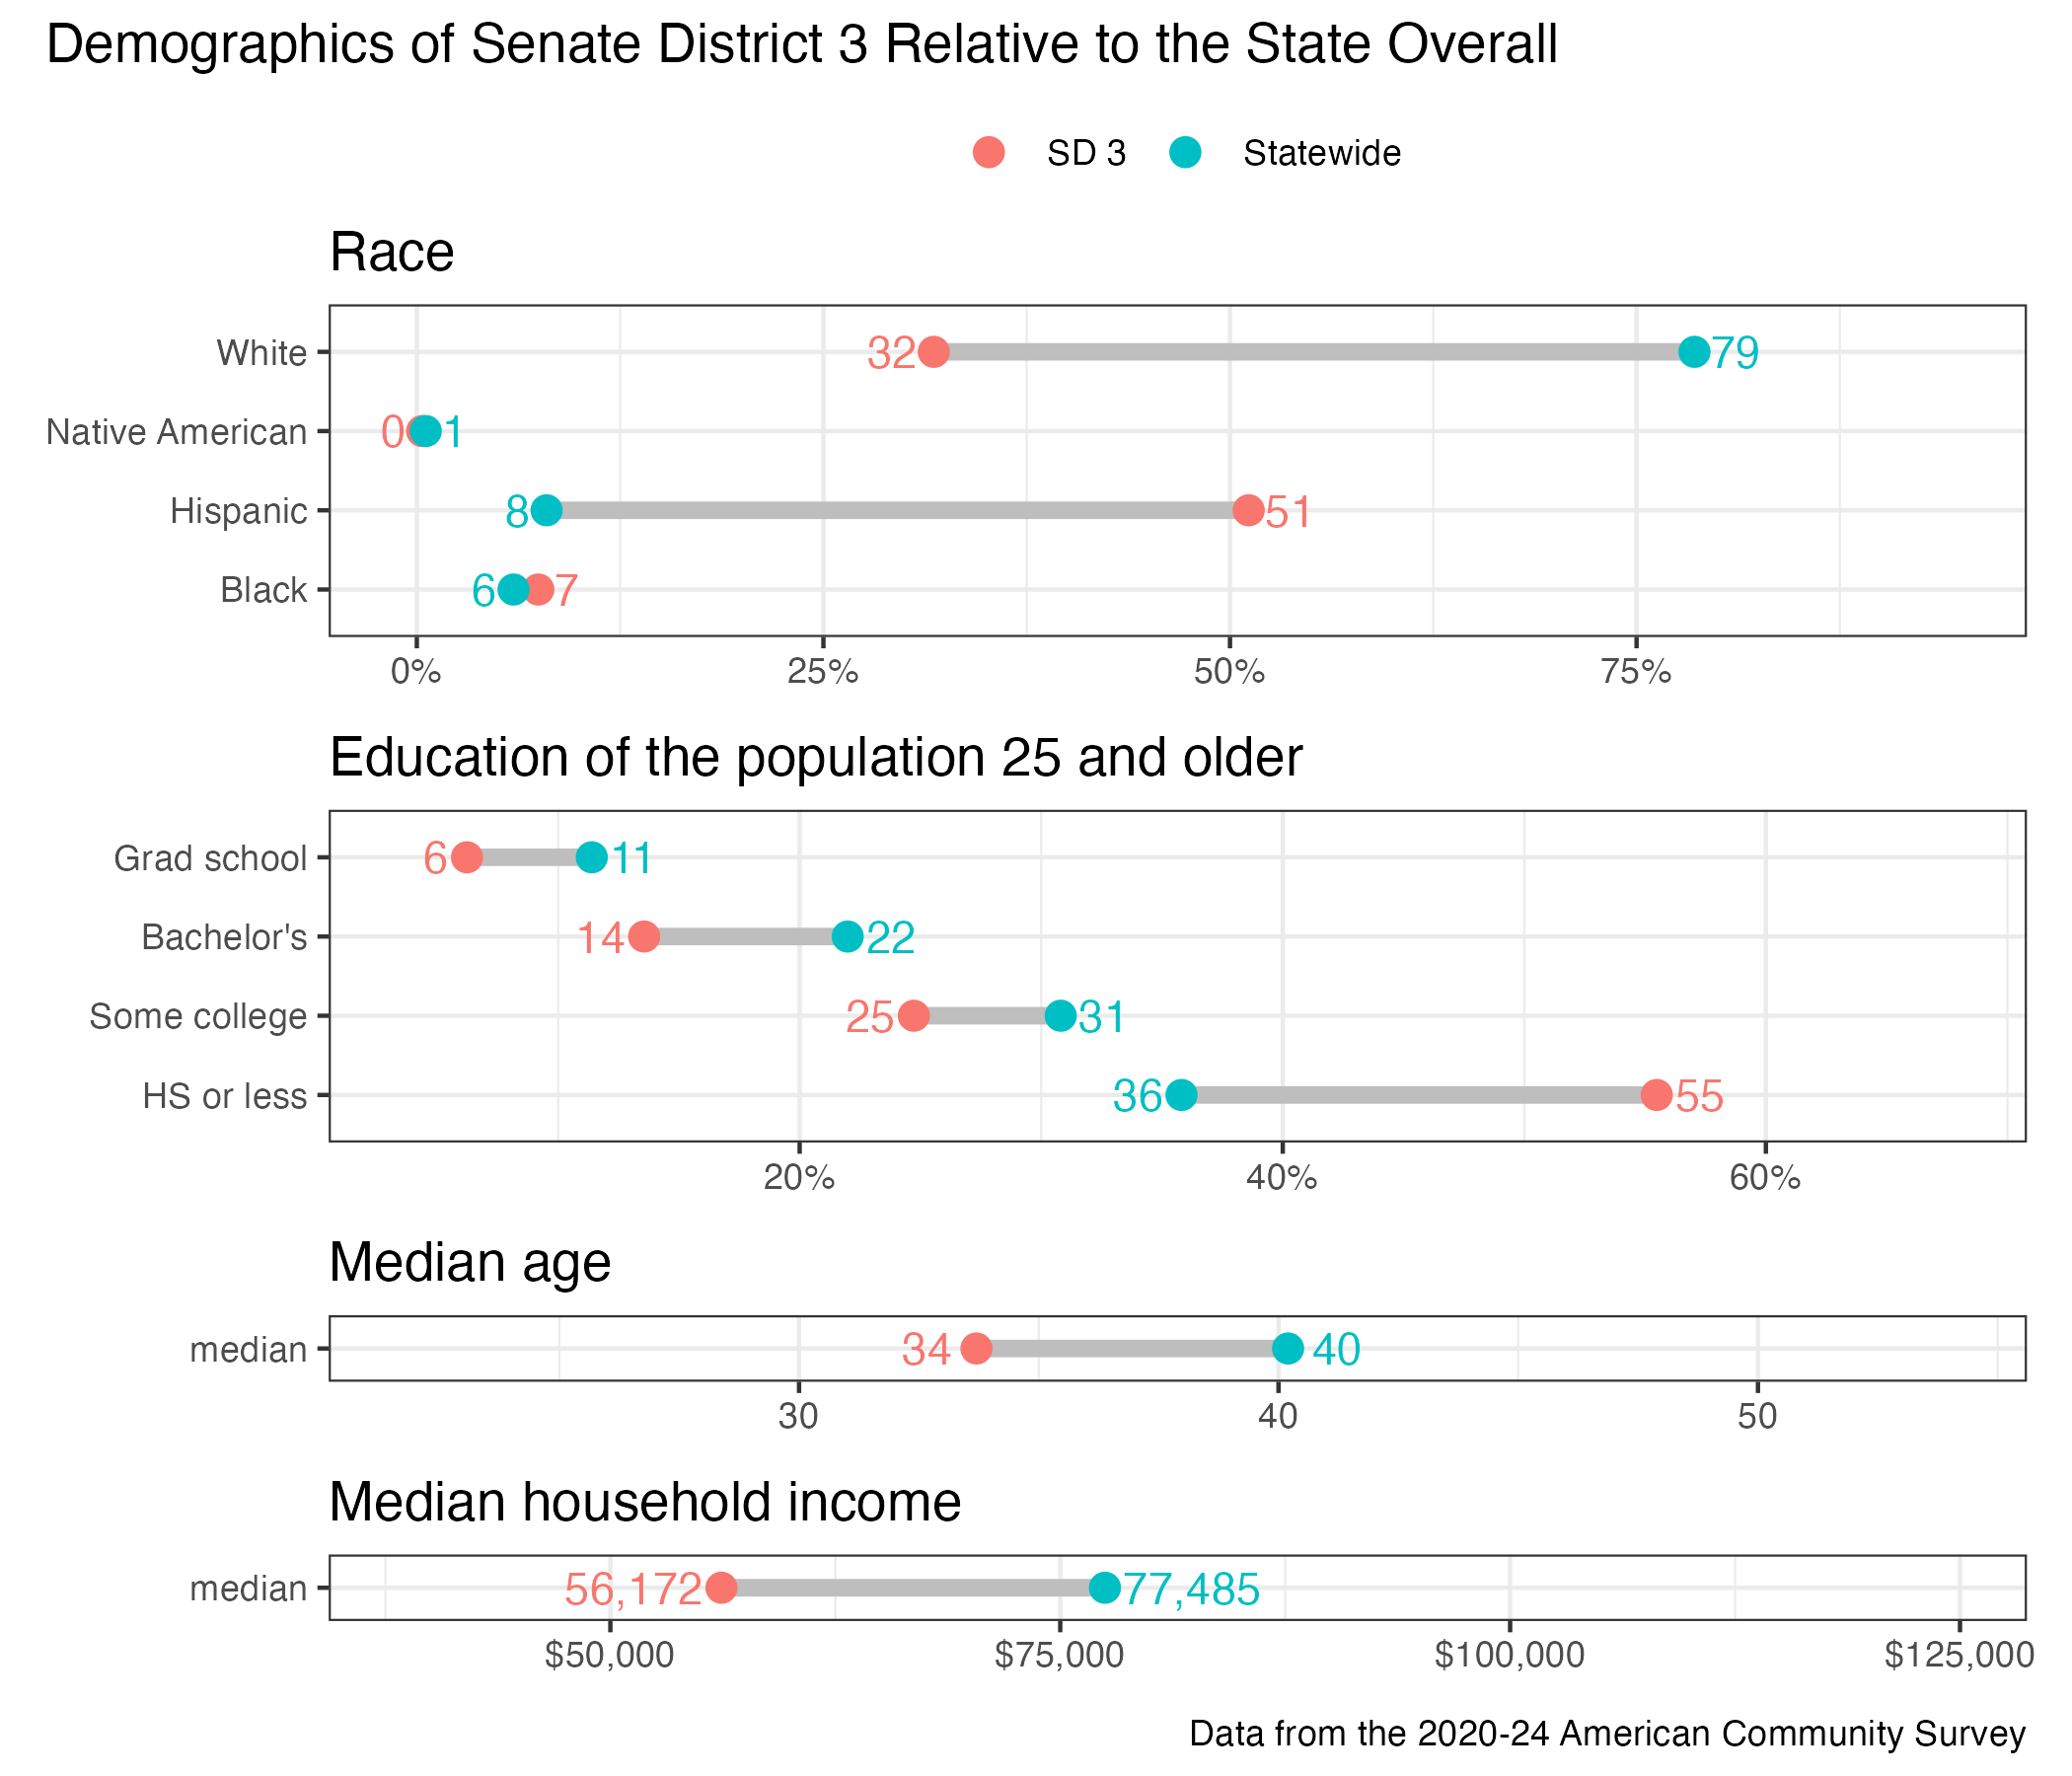
District demographics