98th Assembly District
District
Candidates
| Assembly District 98 Candidates on the Primary Ballot | ||
| Incumbent: Jim Piwowarczyk | ||
Jan 1 thru July 30
|
||
|---|---|---|
| receipts | disbursements | |
| Republican | ||
| Jim Piwowarczyk | $12,199.68 | $11,069.36 |
| Democratic | ||
| Matt Philibert | $0.00 | $0.00 |
| Data from the 2026 July Continuing Report. Any amended reports might not yet be shown. | ||
Past election results
| Election Results in Wisconsin State Assembly District 98 | ||||||
votes
|
Dem. %1 |
margin (Dem. - Rep.)
|
||||
|---|---|---|---|---|---|---|
| total | Dem. | Rep. | votes | points2 | ||
| 2016 President | 34,004 | 9,225 | 22,845 | 28.8% | −13,620 | −42.5 |
| 2016 Senator | 34,204 | 8,545 | 24,999 | 25.5% | −16,454 | −49.1 |
| 2018 Governor | 31,779 | 8,309 | 23,081 | 26.5% | −14,772 | −47.1 |
| 2018 Senator | 31,599 | 10,125 | 21,459 | 32.1% | −11,334 | −35.9 |
| 2020 President | 39,444 | 12,248 | 26,685 | 31.5% | −14,437 | −37.1 |
| 2022 Governor | 33,770 | 10,559 | 22,966 | 31.5% | −12,407 | −37.0 |
| 2022 Senator | 33,707 | 9,928 | 23,745 | 29.5% | −13,817 | −41.0 |
| 2024 President | 41,920 | 13,278 | 28,055 | 32.1% | −14,777 | −35.8 |
| 2024 Senator | 41,595 | 12,889 | 28,058 | 31.5% | −15,169 | −37.0 |
| 2024 WI Assembly | 40,551 | 11,698 | 28,823 | 28.9% | −17,125 | −42.3 |
| 2025 WI Sup. Ct.3 | 30,422 | 10,422 | 19,989 | 34.3% | −9,567 | −31.5 |
| 1 Share of the two-party vote. For Rep. share, subtract from 100. | ||||||
| 2 Dem % of the two-party vote minus Rep % of the two-party vote | ||||||
| 3 Formally nonpartisan candidates assigned party labels based on state endorsements | ||||||
| Election results allocated into 2024 district boundaries based on population overlap. Calculations by John Johnson (johndjohnson.info). | ||||||
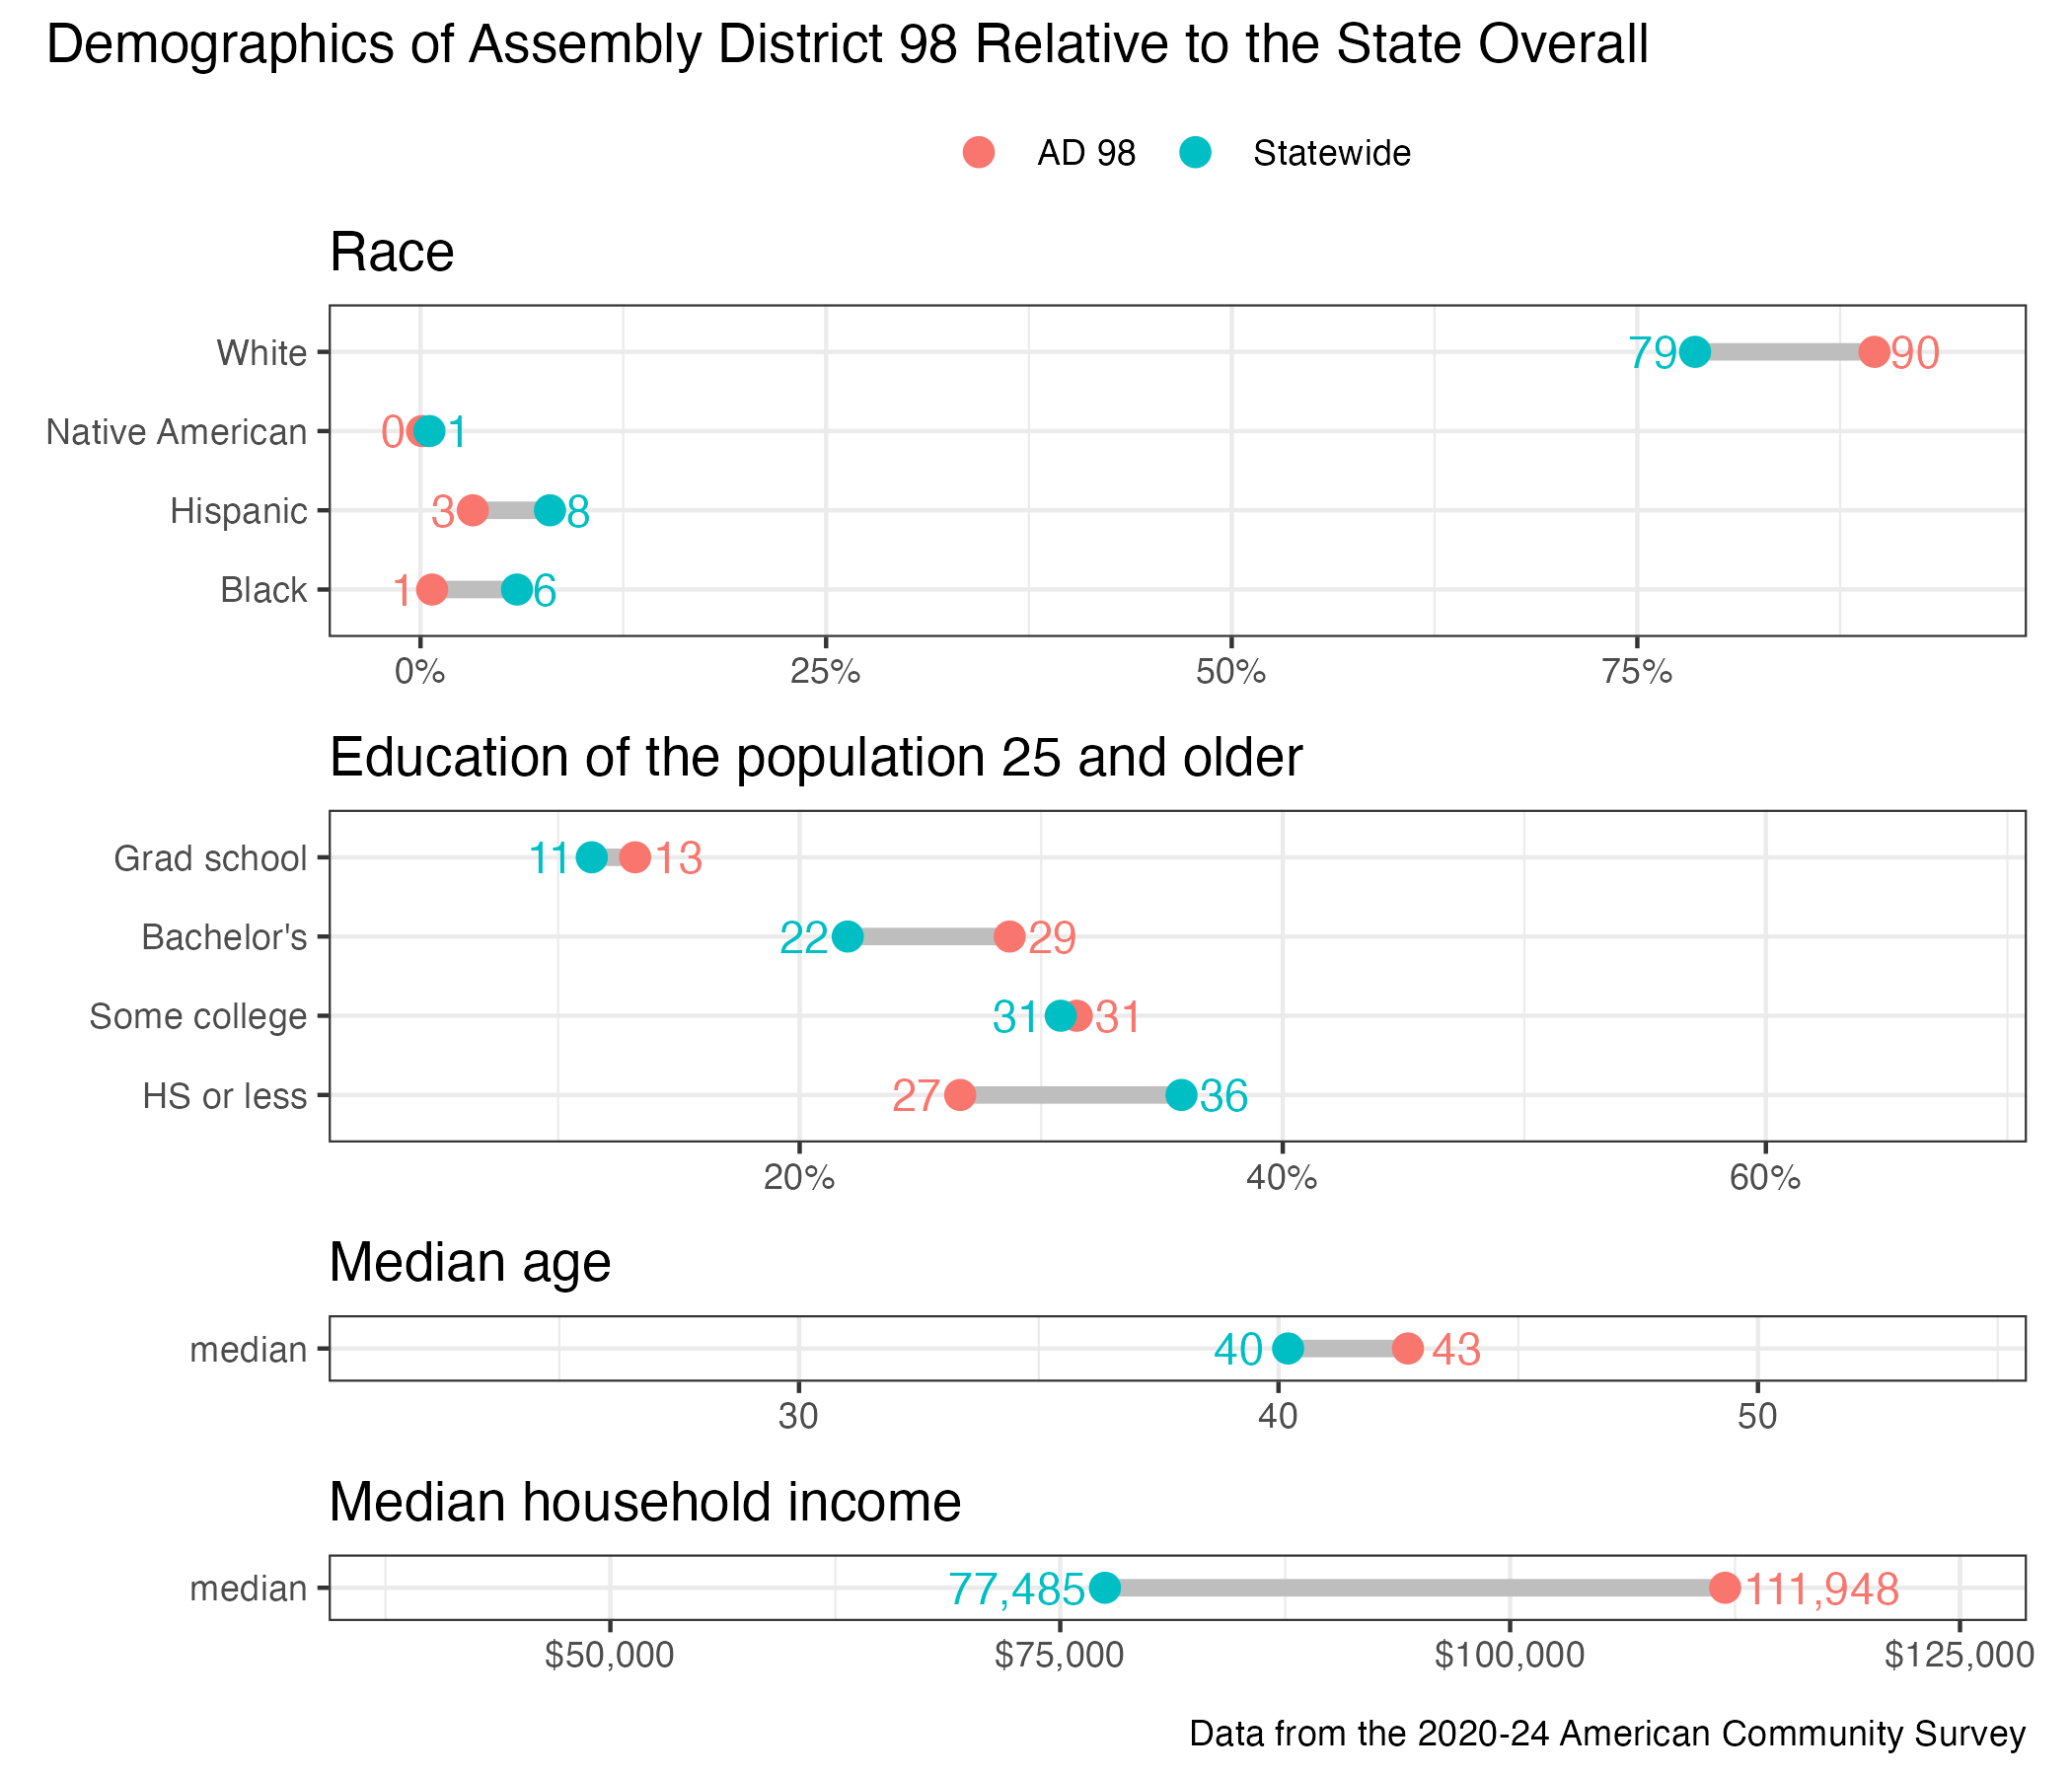
District demographics