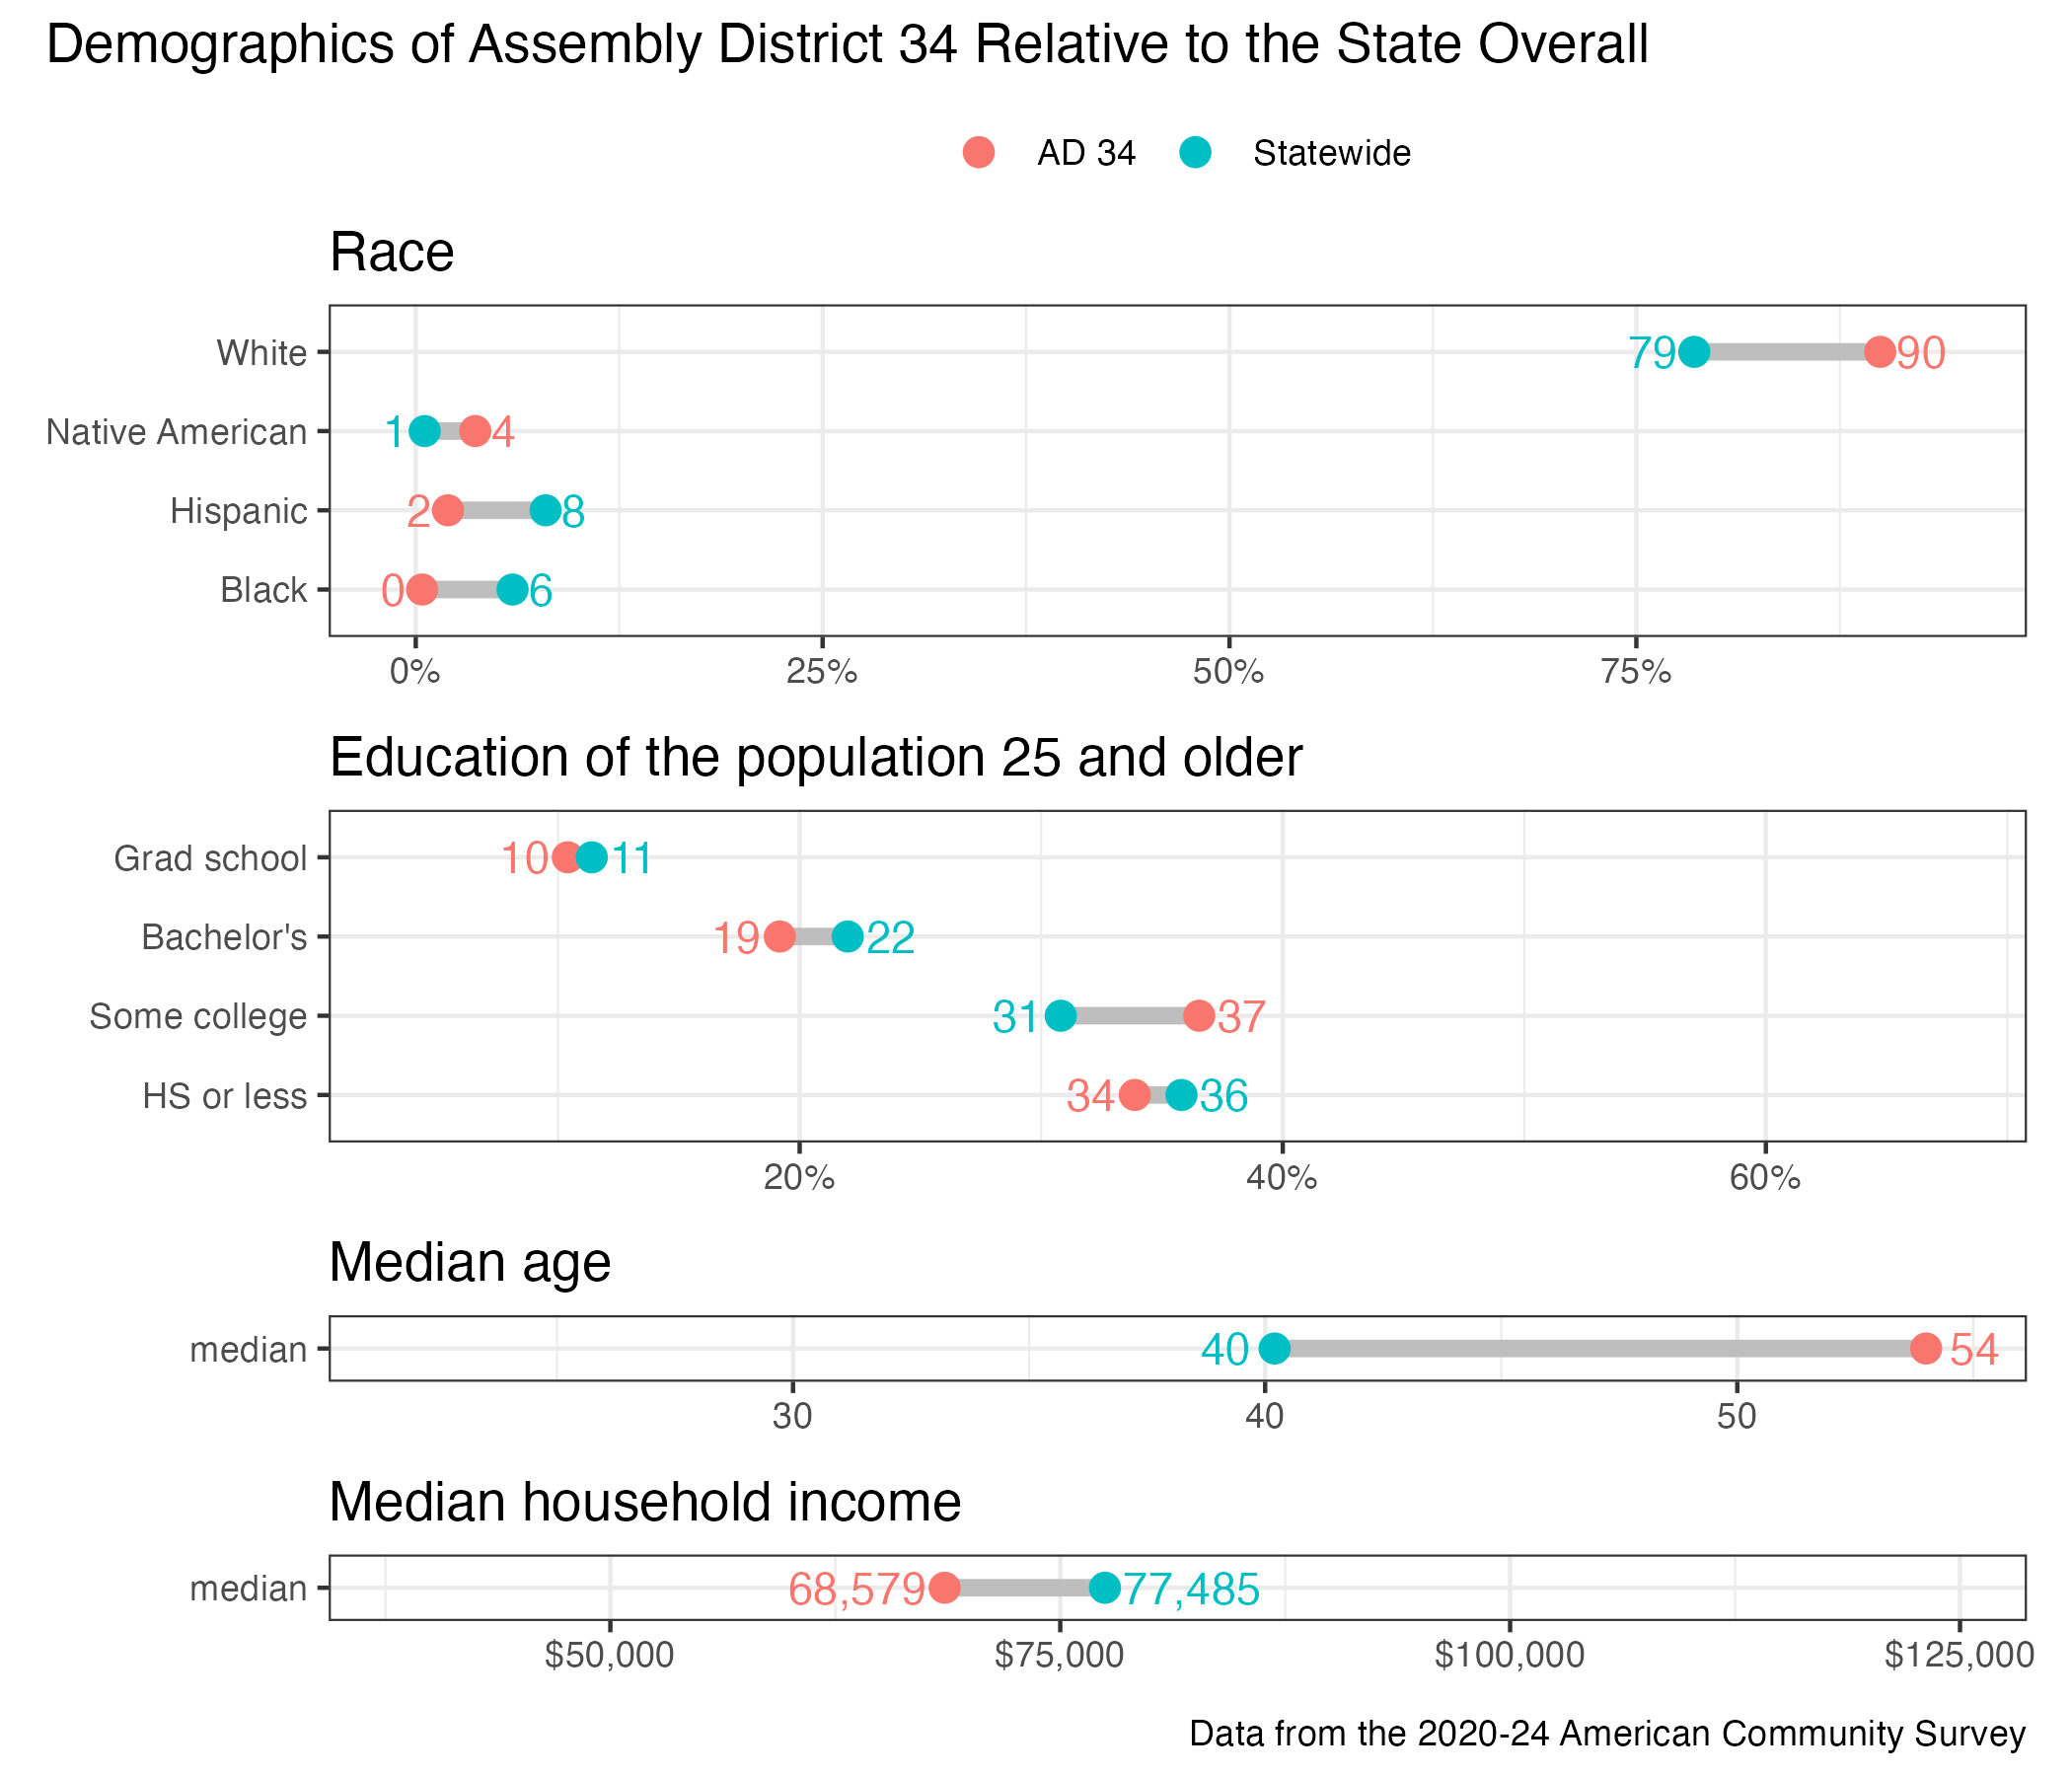
34th Assembly District
District
Candidates
| Assembly District 34 Candidates on the Primary Ballot | ||
| Incumbent: Rob Swearingen | ||
Jan 1 thru July 30
|
||
|---|---|---|
| receipts | disbursements | |
| Republican | ||
| Rob Swearingen | $23,580.00 | $6,058.30 |
| Democratic | ||
| Merlin Van Buren | $9,945.00 | $1,765.40 |
| Data from the 2026 July Continuing Report. Any amended reports might not yet be shown. | ||
Past election results
| Election Results in Wisconsin State Assembly District 34 | ||||||
votes
|
Dem. %1 |
margin (Dem. - Rep.)
|
||||
|---|---|---|---|---|---|---|
| total | Dem. | Rep. | votes | points2 | ||
| 2016 President | 34,290 | 12,539 | 19,825 | 38.7% | −7,286 | −22.5 |
| 2016 Senator | 33,931 | 12,763 | 19,846 | 39.1% | −7,083 | −21.7 |
| 2018 Governor | 31,332 | 12,031 | 18,616 | 39.3% | −6,585 | −21.5 |
| 2018 Senator | 31,179 | 14,249 | 16,890 | 45.8% | −2,641 | −8.5 |
| 2020 President | 38,513 | 15,597 | 22,335 | 41.1% | −6,738 | −17.8 |
| 2022 Governor | 32,585 | 13,416 | 18,763 | 41.7% | −5,347 | −16.6 |
| 2022 Senator | 32,502 | 12,754 | 19,683 | 39.3% | −6,929 | −21.4 |
| 2024 President | 39,968 | 15,784 | 23,652 | 40.0% | −7,868 | −20.0 |
| 2024 Senator | 39,626 | 15,961 | 22,890 | 41.1% | −6,929 | −17.8 |
| 2024 WI Assembly | 39,091 | 14,027 | 25,040 | 35.9% | −11,013 | −28.2 |
| 2025 WI Sup. Ct.3 | 27,363 | 11,997 | 15,338 | 43.9% | −3,341 | −12.2 |
| 1 Share of the two-party vote. For Rep. share, subtract from 100. | ||||||
| 2 Dem % of the two-party vote minus Rep % of the two-party vote | ||||||
| 3 Formally nonpartisan candidates assigned party labels based on state endorsements | ||||||
| Election results allocated into 2024 district boundaries based on population overlap. Calculations by John Johnson (johndjohnson.info). | ||||||
District demographics