91st Assembly District
District
Candidates
| Assembly District 91 Candidates on the Primary Ballot | ||
| Incumbent: Jodi Emerson | ||
Jan 1 thru July 30
|
||
|---|---|---|
| receipts | disbursements | |
| Republican | ||
| Bruce Stabenow | $1,900.00 | $1,304.00 |
| Democratic | ||
| Jodi Emerson | $67,371.27 | $15,350.71 |
| Data from the 2026 July Continuing Report. Any amended reports might not yet be shown. | ||
Past election results
| Election Results in Wisconsin State Assembly District 91 | ||||||
votes
|
Dem. %1 |
margin (Dem. - Rep.)
|
||||
|---|---|---|---|---|---|---|
| total | Dem. | Rep. | votes | points2 | ||
| 2016 President | 29,794 | 14,148 | 13,442 | 51.3% | +706 | +2.6 |
| 2016 Senator | 29,437 | 14,487 | 13,789 | 51.2% | +698 | +2.5 |
| 2018 Governor | 27,245 | 14,389 | 12,159 | 54.2% | +2,230 | +8.4 |
| 2018 Senator | 27,100 | 16,108 | 10,950 | 59.5% | +5,158 | +19.1 |
| 2020 President | 33,357 | 17,302 | 15,324 | 53.0% | +1,978 | +6.1 |
| 2022 Governor | 26,948 | 14,914 | 11,702 | 56.0% | +3,212 | +12.1 |
| 2022 Senator | 26,572 | 13,967 | 12,537 | 52.7% | +1,430 | +5.4 |
| 2024 President | 35,138 | 18,067 | 16,478 | 52.3% | +1,589 | +4.6 |
| 2024 Senator | 34,742 | 18,226 | 15,666 | 53.8% | +2,560 | +7.6 |
| 2024 WI Assembly | 34,377 | 17,712 | 16,610 | 51.6% | +1,102 | +3.2 |
| 2025 WI Sup. Ct.3 | 24,218 | 14,486 | 9,710 | 59.9% | +4,776 | +19.7 |
| 1 Share of the two-party vote. For Rep. share, subtract from 100. | ||||||
| 2 Dem % of the two-party vote minus Rep % of the two-party vote | ||||||
| 3 Formally nonpartisan candidates assigned party labels based on state endorsements | ||||||
| Election results allocated into 2024 district boundaries based on population overlap. Calculations by John Johnson (johndjohnson.info). | ||||||
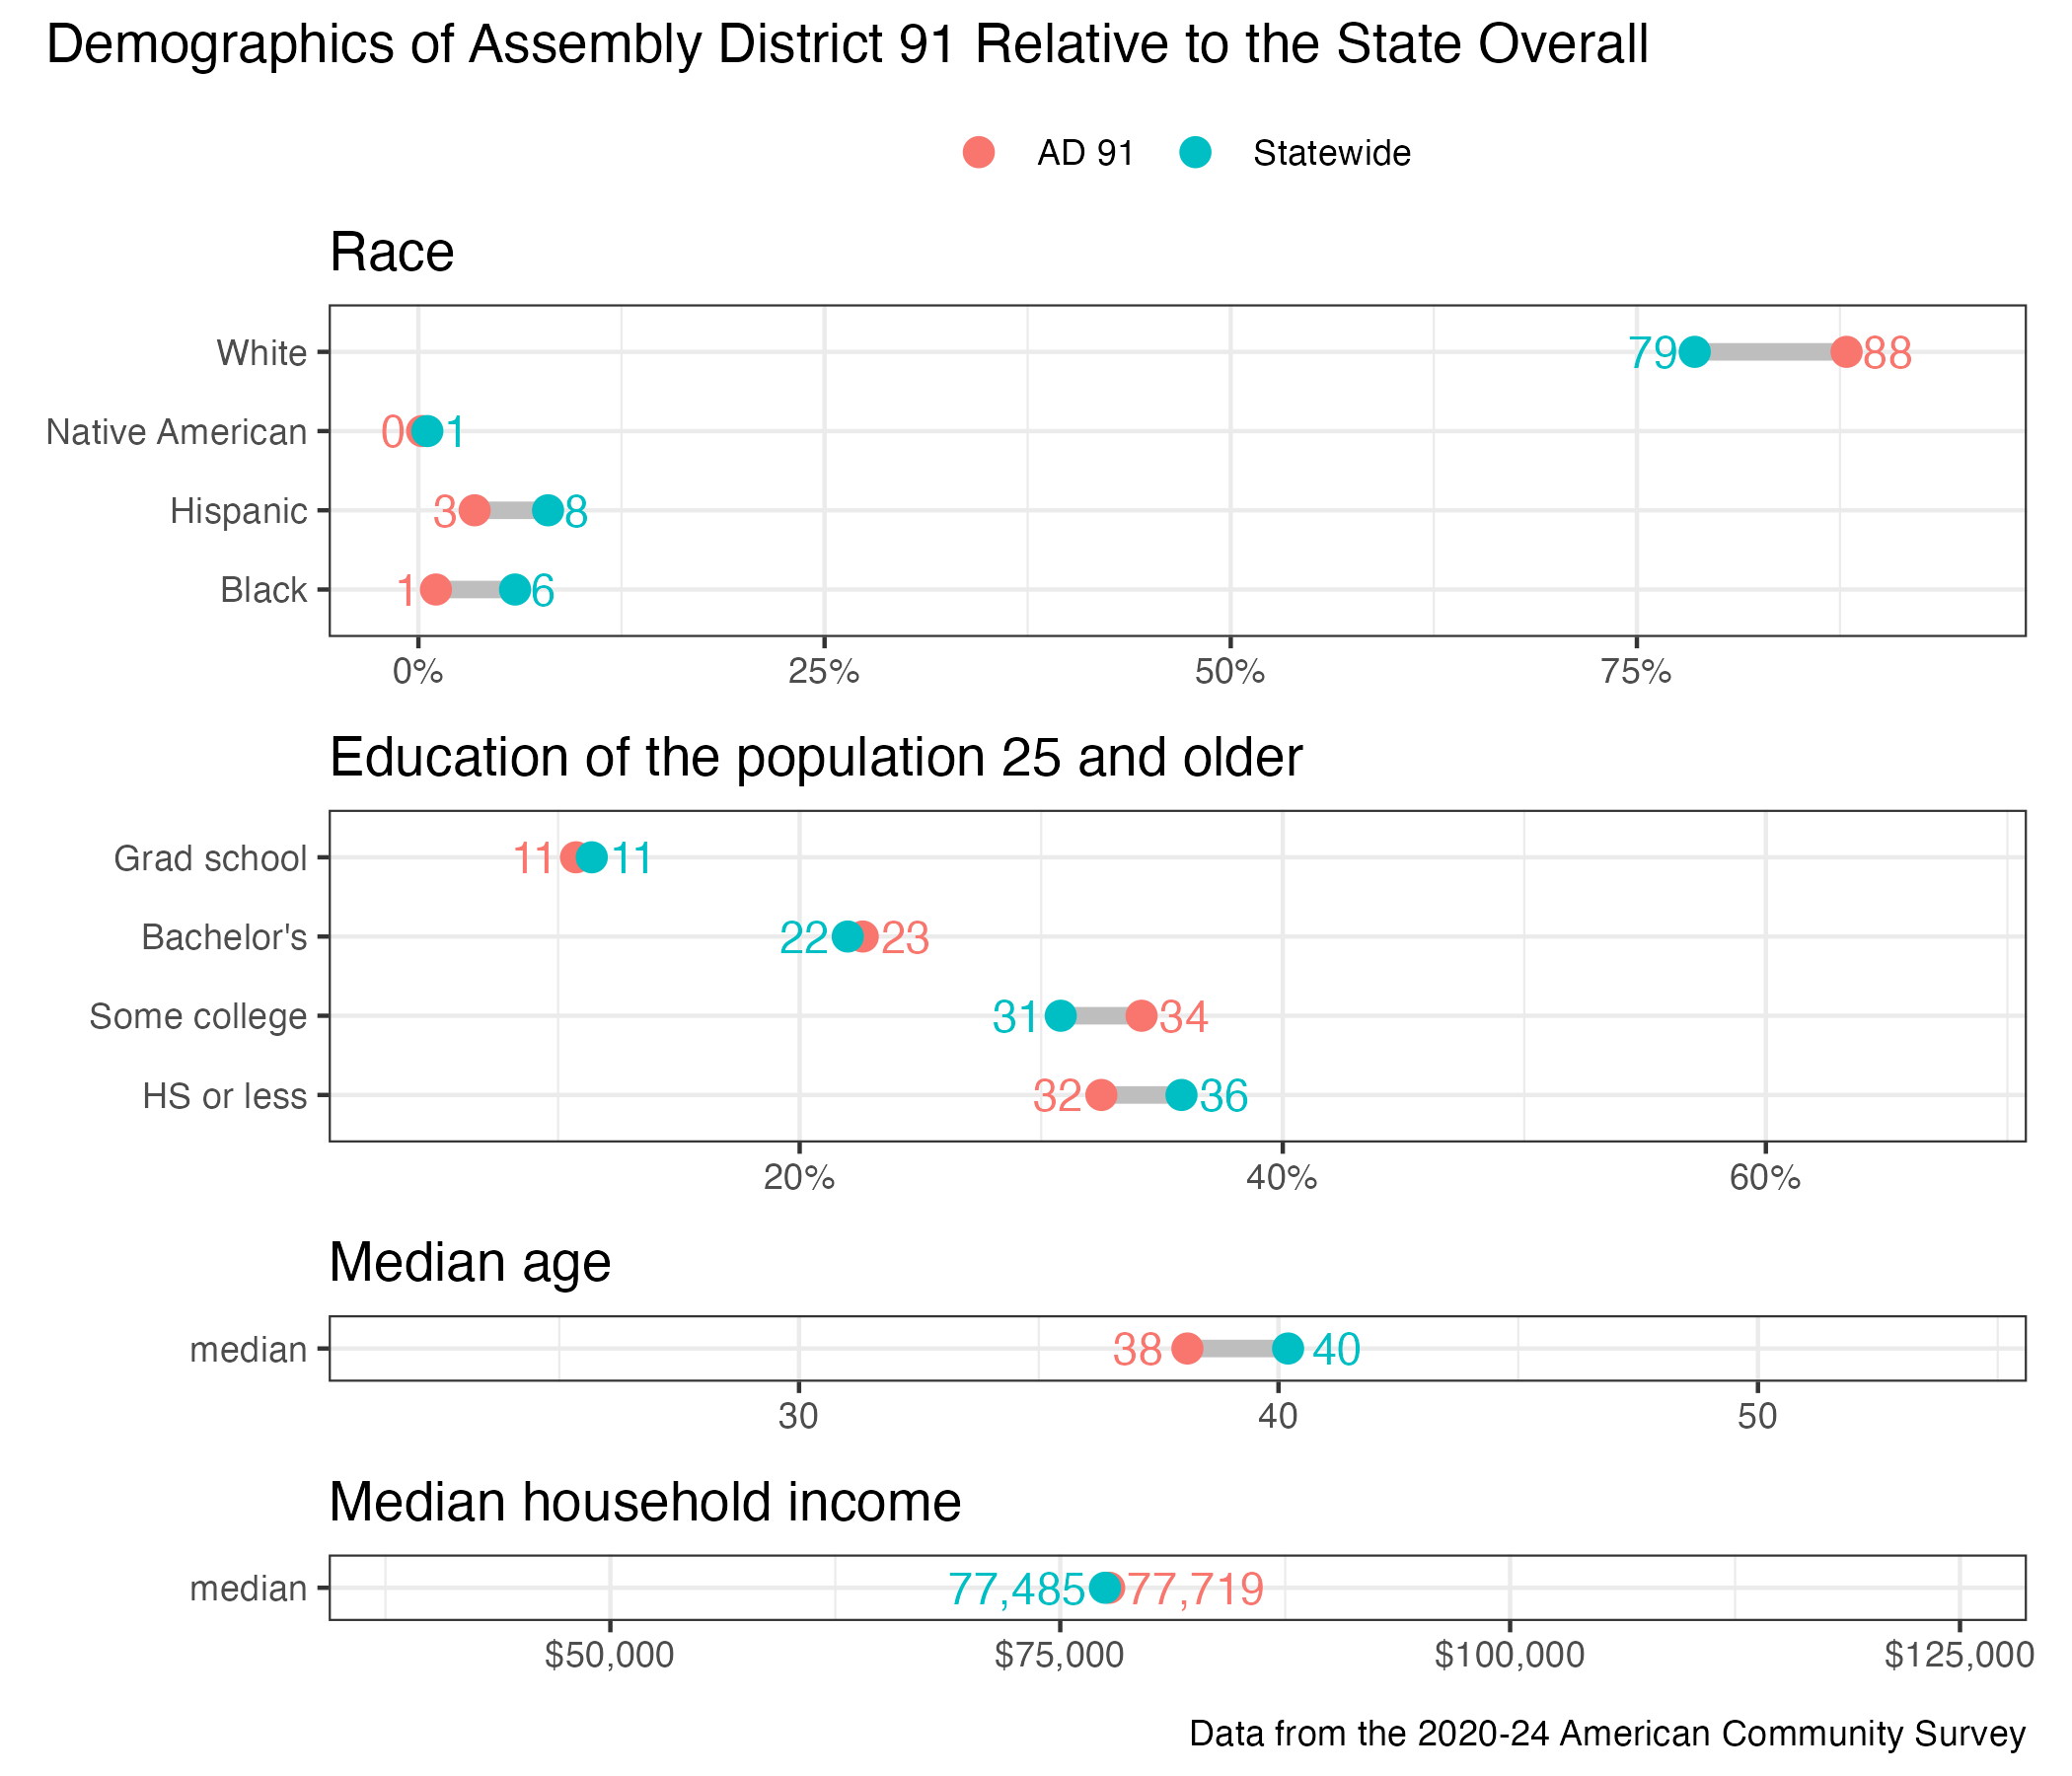
District demographics