40th Assembly District
District
Candidates
| Assembly District 40 Candidates on the Primary Ballot | ||
| Incumbent: Karen DeSanto | ||
Jan 1 thru July 30
|
||
|---|---|---|
| receipts | disbursements | |
| Republican | ||
| Julie Helmer | $6,713.58 | $2,870.51 |
| Democratic | ||
| Karen DeSanto | $19,004.55 | $3,755.12 |
| Data from the 2026 July Continuing Report. Any amended reports might not yet be shown. | ||
Past election results
| Election Results in Wisconsin State Assembly District 40 | ||||||
votes
|
Dem. %1 |
margin (Dem. - Rep.)
|
||||
|---|---|---|---|---|---|---|
| total | Dem. | Rep. | votes | points2 | ||
| 2016 President | 29,171 | 14,414 | 12,975 | 52.6% | +1,439 | +5.3 |
| 2016 Senator | 29,153 | 16,037 | 12,309 | 56.6% | +3,728 | +13.2 |
| 2018 Governor | 26,939 | 15,226 | 11,102 | 57.8% | +4,124 | +15.7 |
| 2018 Senator | 26,837 | 16,314 | 10,509 | 60.8% | +5,805 | +21.6 |
| 2020 President | 33,286 | 17,654 | 15,074 | 53.9% | +2,580 | +7.9 |
| 2022 Governor | 26,533 | 14,979 | 11,273 | 57.1% | +3,706 | +14.1 |
| 2022 Senator | 26,478 | 14,349 | 12,102 | 54.2% | +2,247 | +8.5 |
| 2024 President | 34,241 | 17,681 | 16,021 | 52.5% | +1,660 | +4.9 |
| 2024 Senator | 33,906 | 17,953 | 15,217 | 54.1% | +2,736 | +8.2 |
| 2024 WI Assembly | 33,186 | 17,949 | 15,221 | 54.1% | +2,728 | +8.2 |
| 2025 WI Sup. Ct.3 | 24,327 | 14,534 | 9,788 | 59.8% | +4,746 | +19.5 |
| 1 Share of the two-party vote. For Rep. share, subtract from 100. | ||||||
| 2 Dem % of the two-party vote minus Rep % of the two-party vote | ||||||
| 3 Formally nonpartisan candidates assigned party labels based on state endorsements | ||||||
| Election results allocated into 2024 district boundaries based on population overlap. Calculations by John Johnson (johndjohnson.info). | ||||||
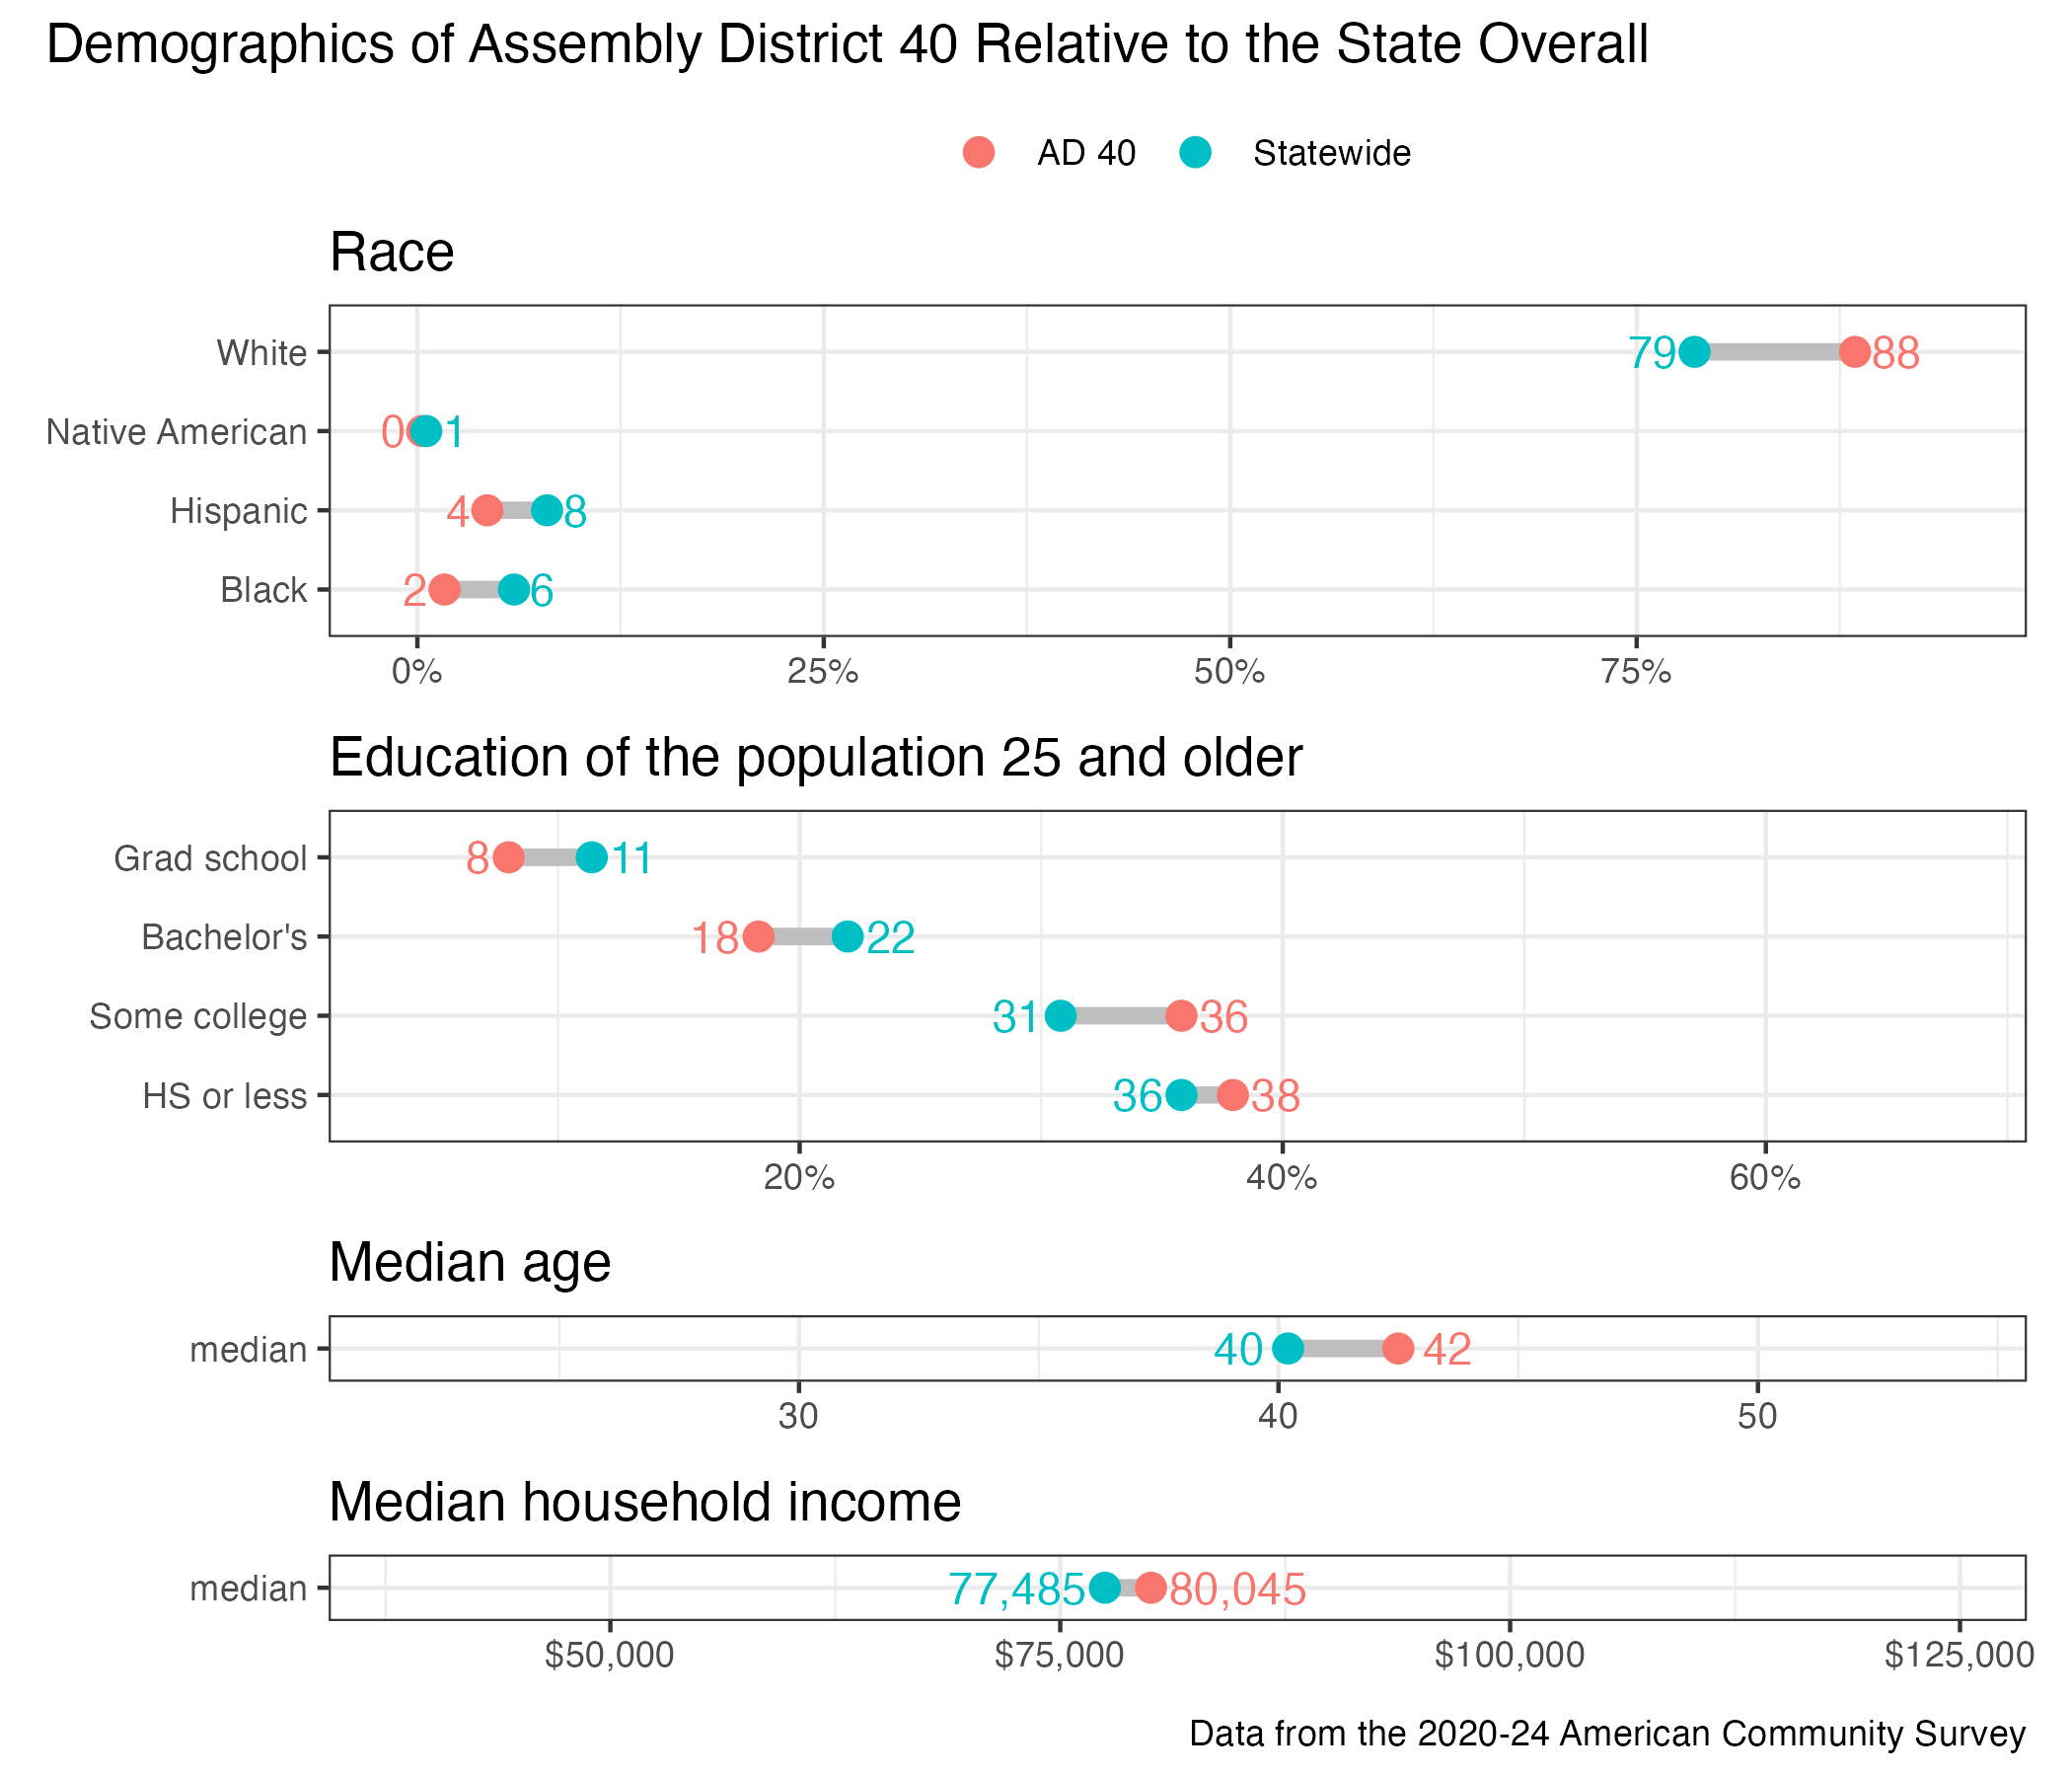
District demographics