3rd Assembly District
District
Candidates
| Assembly District 3 Candidates on the Primary Ballot | ||
| Incumbent: Ron Tusler | ||
Jan 1 thru July 30
|
||
|---|---|---|
| receipts | disbursements | |
| Republican | ||
| Ron Tusler | $9,155.70 | $64,291.21 |
| Data from the 2026 July Continuing Report. Any amended reports might not yet be shown. | ||
Past election results
| Election Results in Wisconsin State Assembly District 3 | ||||||
votes
|
Dem. %1 |
margin (Dem. - Rep.)
|
||||
|---|---|---|---|---|---|---|
| total | Dem. | Rep. | votes | points2 | ||
| 2016 President | 30,363 | 10,657 | 17,888 | 37.3% | −7,231 | −25.3 |
| 2016 Senator | 30,351 | 10,231 | 19,053 | 34.9% | −8,822 | −30.1 |
| 2018 Governor | 26,990 | 9,921 | 16,625 | 37.4% | −6,704 | −25.3 |
| 2018 Senator | 26,843 | 11,948 | 14,893 | 44.5% | −2,945 | −11.0 |
| 2020 President | 34,938 | 13,222 | 21,163 | 38.5% | −7,941 | −23.1 |
| 2022 Governor | 28,496 | 10,866 | 17,330 | 38.5% | −6,464 | −22.9 |
| 2022 Senator | 28,414 | 10,352 | 18,021 | 36.5% | −7,669 | −27.0 |
| 2024 President | 37,256 | 14,094 | 22,606 | 38.4% | −8,512 | −23.2 |
| 2024 Senator | 36,994 | 14,023 | 22,120 | 38.8% | −8,097 | −22.4 |
| 2024 WI Assembly | 36,211 | 12,839 | 23,344 | 35.5% | −10,505 | −29.0 |
| 2025 WI Sup. Ct.3 | 25,028 | 10,669 | 14,342 | 42.7% | −3,673 | −14.7 |
| 1 Share of the two-party vote. For Rep. share, subtract from 100. | ||||||
| 2 Dem % of the two-party vote minus Rep % of the two-party vote | ||||||
| 3 Formally nonpartisan candidates assigned party labels based on state endorsements | ||||||
| Election results allocated into 2024 district boundaries based on population overlap. Calculations by John Johnson (johndjohnson.info). | ||||||
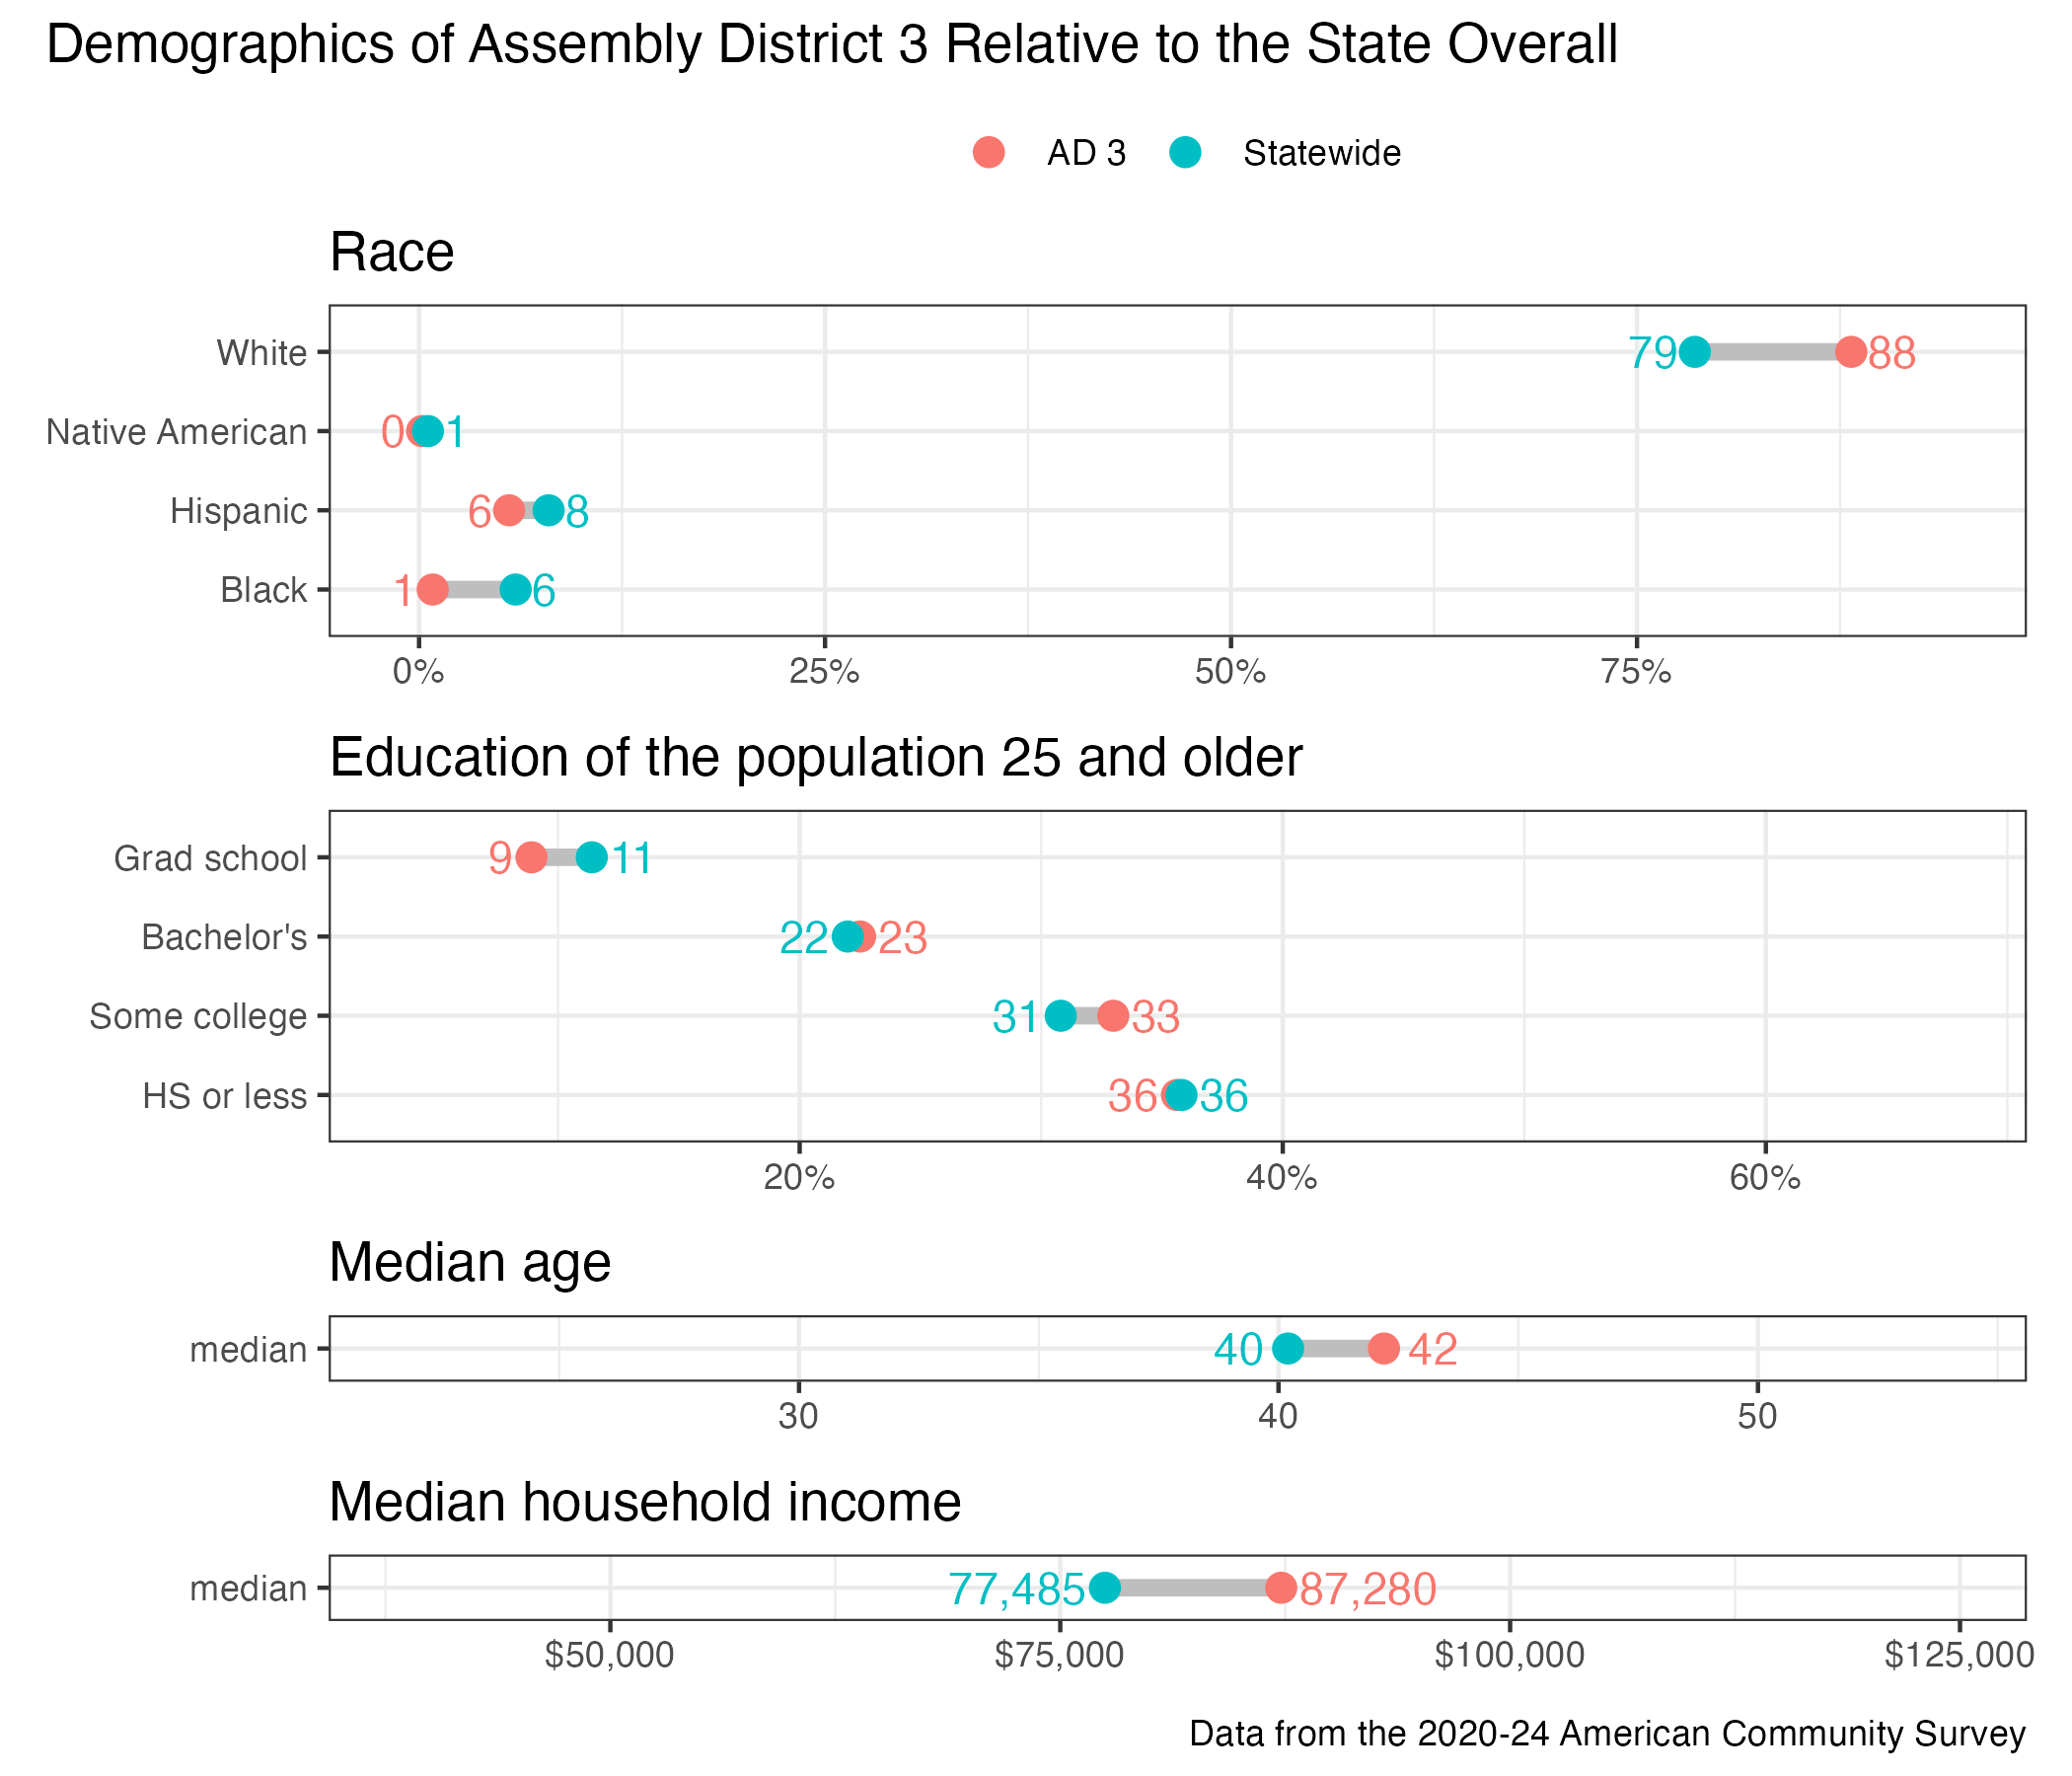
District demographics