94th Assembly District
District
Candidates
| Assembly District 94 Candidates on the Primary Ballot | ||
| Incumbent: Steve Doyle | ||
Jan 1 thru July 30
|
||
|---|---|---|
| receipts | disbursements | |
| Republican | ||
| Keith Purnell | $24,015.00 | $3,915.02 |
| Democratic | ||
| Steve Doyle | $51,337.18 | $86,865.48 |
| Data from the 2026 July Continuing Report. Any amended reports might not yet be shown. | ||
Past election results
| Election Results in Wisconsin State Assembly District 94 | ||||||
votes
|
Dem. %1 |
margin (Dem. - Rep.)
|
||||
|---|---|---|---|---|---|---|
| total | Dem. | Rep. | votes | points2 | ||
| 2016 President | 30,415 | 13,765 | 14,646 | 48.4% | −881 | −3.1 |
| 2016 Senator | 30,093 | 14,161 | 14,993 | 48.6% | −832 | −2.9 |
| 2018 Governor | 27,452 | 13,391 | 13,463 | 49.9% | −72 | −0.3 |
| 2018 Senator | 27,353 | 15,415 | 11,936 | 56.4% | +3,479 | +12.7 |
| 2020 President | 34,831 | 17,094 | 17,085 | 50.0% | +9 | +0.0 |
| 2022 Governor | 27,658 | 14,197 | 13,116 | 52.0% | +1,081 | +4.0 |
| 2022 Senator | 27,712 | 13,414 | 14,249 | 48.5% | −835 | −3.0 |
| 2024 President | 37,049 | 17,881 | 18,675 | 48.9% | −794 | −2.2 |
| 2024 Senator | 36,786 | 17,998 | 18,011 | 50.0% | −13 | 0.0 |
| 2024 WI Assembly | 36,657 | 18,436 | 18,219 | 50.3% | +217 | +0.6 |
| 2025 WI Sup. Ct.3 | 24,663 | 13,851 | 10,810 | 56.2% | +3,041 | +12.3 |
| 1 Share of the two-party vote. For Rep. share, subtract from 100. | ||||||
| 2 Dem % of the two-party vote minus Rep % of the two-party vote | ||||||
| 3 Formally nonpartisan candidates assigned party labels based on state endorsements | ||||||
| Election results allocated into 2024 district boundaries based on population overlap. Calculations by John Johnson (johndjohnson.info). | ||||||
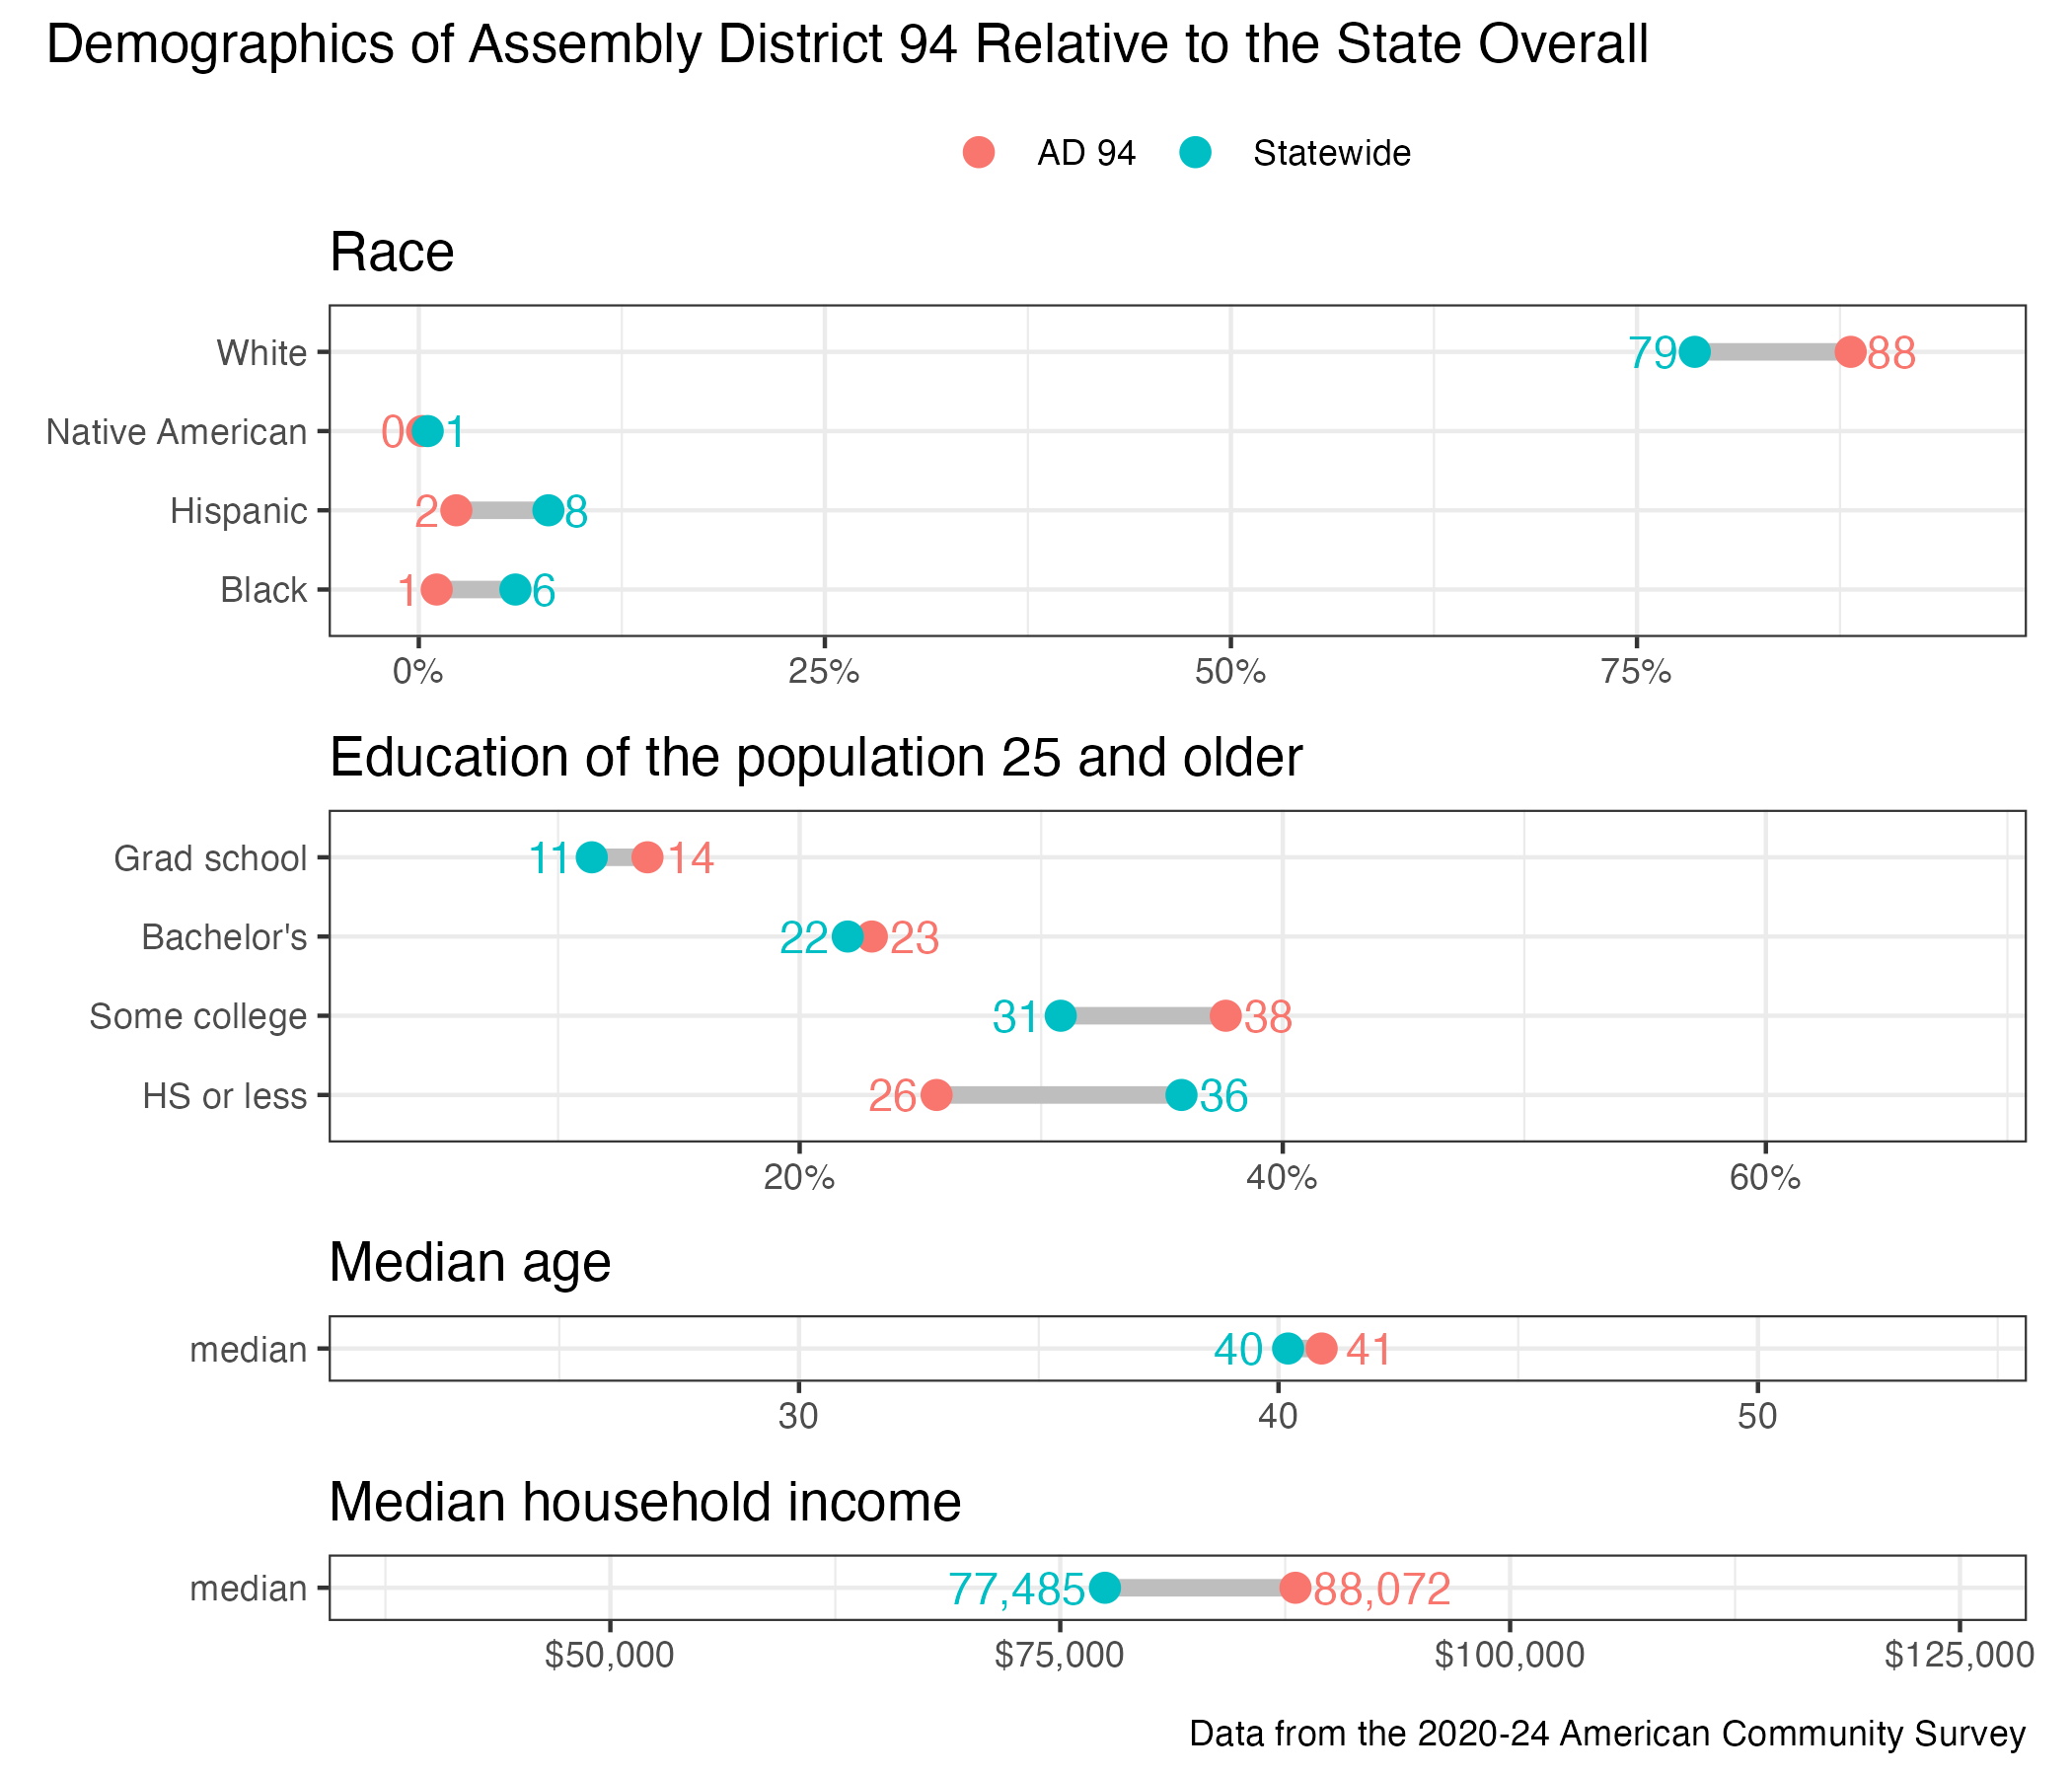
District demographics