92nd Assembly District
District
Candidates
| Assembly District 92 Candidates on the Primary Ballot | ||
| Incumbent: Clint Moses | ||
Jan 1 thru July 30
|
||
|---|---|---|
| receipts | disbursements | |
| Republican | ||
| Clint Moses | $25,382.00 | $4,223.69 |
| Democratic | ||
| Jeremiah Fredrickson | $45,538.64 | $8,658.74 |
| Mel M. Marin | $430.00 | $284.00 |
| Data from the 2026 July Continuing Report. Any amended reports might not yet be shown. | ||
Past election results
| Election Results in Wisconsin State Assembly District 92 | ||||||
votes
|
Dem. %1 |
margin (Dem. - Rep.)
|
||||
|---|---|---|---|---|---|---|
| total | Dem. | Rep. | votes | points2 | ||
| 2016 President | 27,919 | 12,382 | 13,501 | 47.8% | −1,119 | −4.3 |
| 2016 Senator | 27,618 | 12,830 | 13,641 | 48.5% | −811 | −3.1 |
| 2018 Governor | 23,885 | 11,812 | 11,399 | 50.9% | +413 | +1.8 |
| 2018 Senator | 23,779 | 13,383 | 10,395 | 56.3% | +2,988 | +12.6 |
| 2020 President | 30,199 | 14,043 | 15,506 | 47.5% | −1,463 | −5.0 |
| 2022 Governor | 24,007 | 11,860 | 11,831 | 50.1% | +29 | +0.1 |
| 2022 Senator | 23,792 | 11,189 | 12,573 | 47.1% | −1,384 | −5.8 |
| 2024 President | 33,070 | 15,152 | 17,459 | 46.5% | −2,307 | −7.1 |
| 2024 Senator | 32,693 | 15,323 | 16,602 | 48.0% | −1,279 | −4.0 |
| 2024 WI Assembly | 31,939 | 14,908 | 17,009 | 46.7% | −2,101 | −6.6 |
| 2025 WI Sup. Ct.3 | 21,955 | 12,029 | 9,919 | 54.8% | +2,110 | +9.6 |
| 1 Share of the two-party vote. For Rep. share, subtract from 100. | ||||||
| 2 Dem % of the two-party vote minus Rep % of the two-party vote | ||||||
| 3 Formally nonpartisan candidates assigned party labels based on state endorsements | ||||||
| Election results allocated into 2024 district boundaries based on population overlap. Calculations by John Johnson (johndjohnson.info). | ||||||
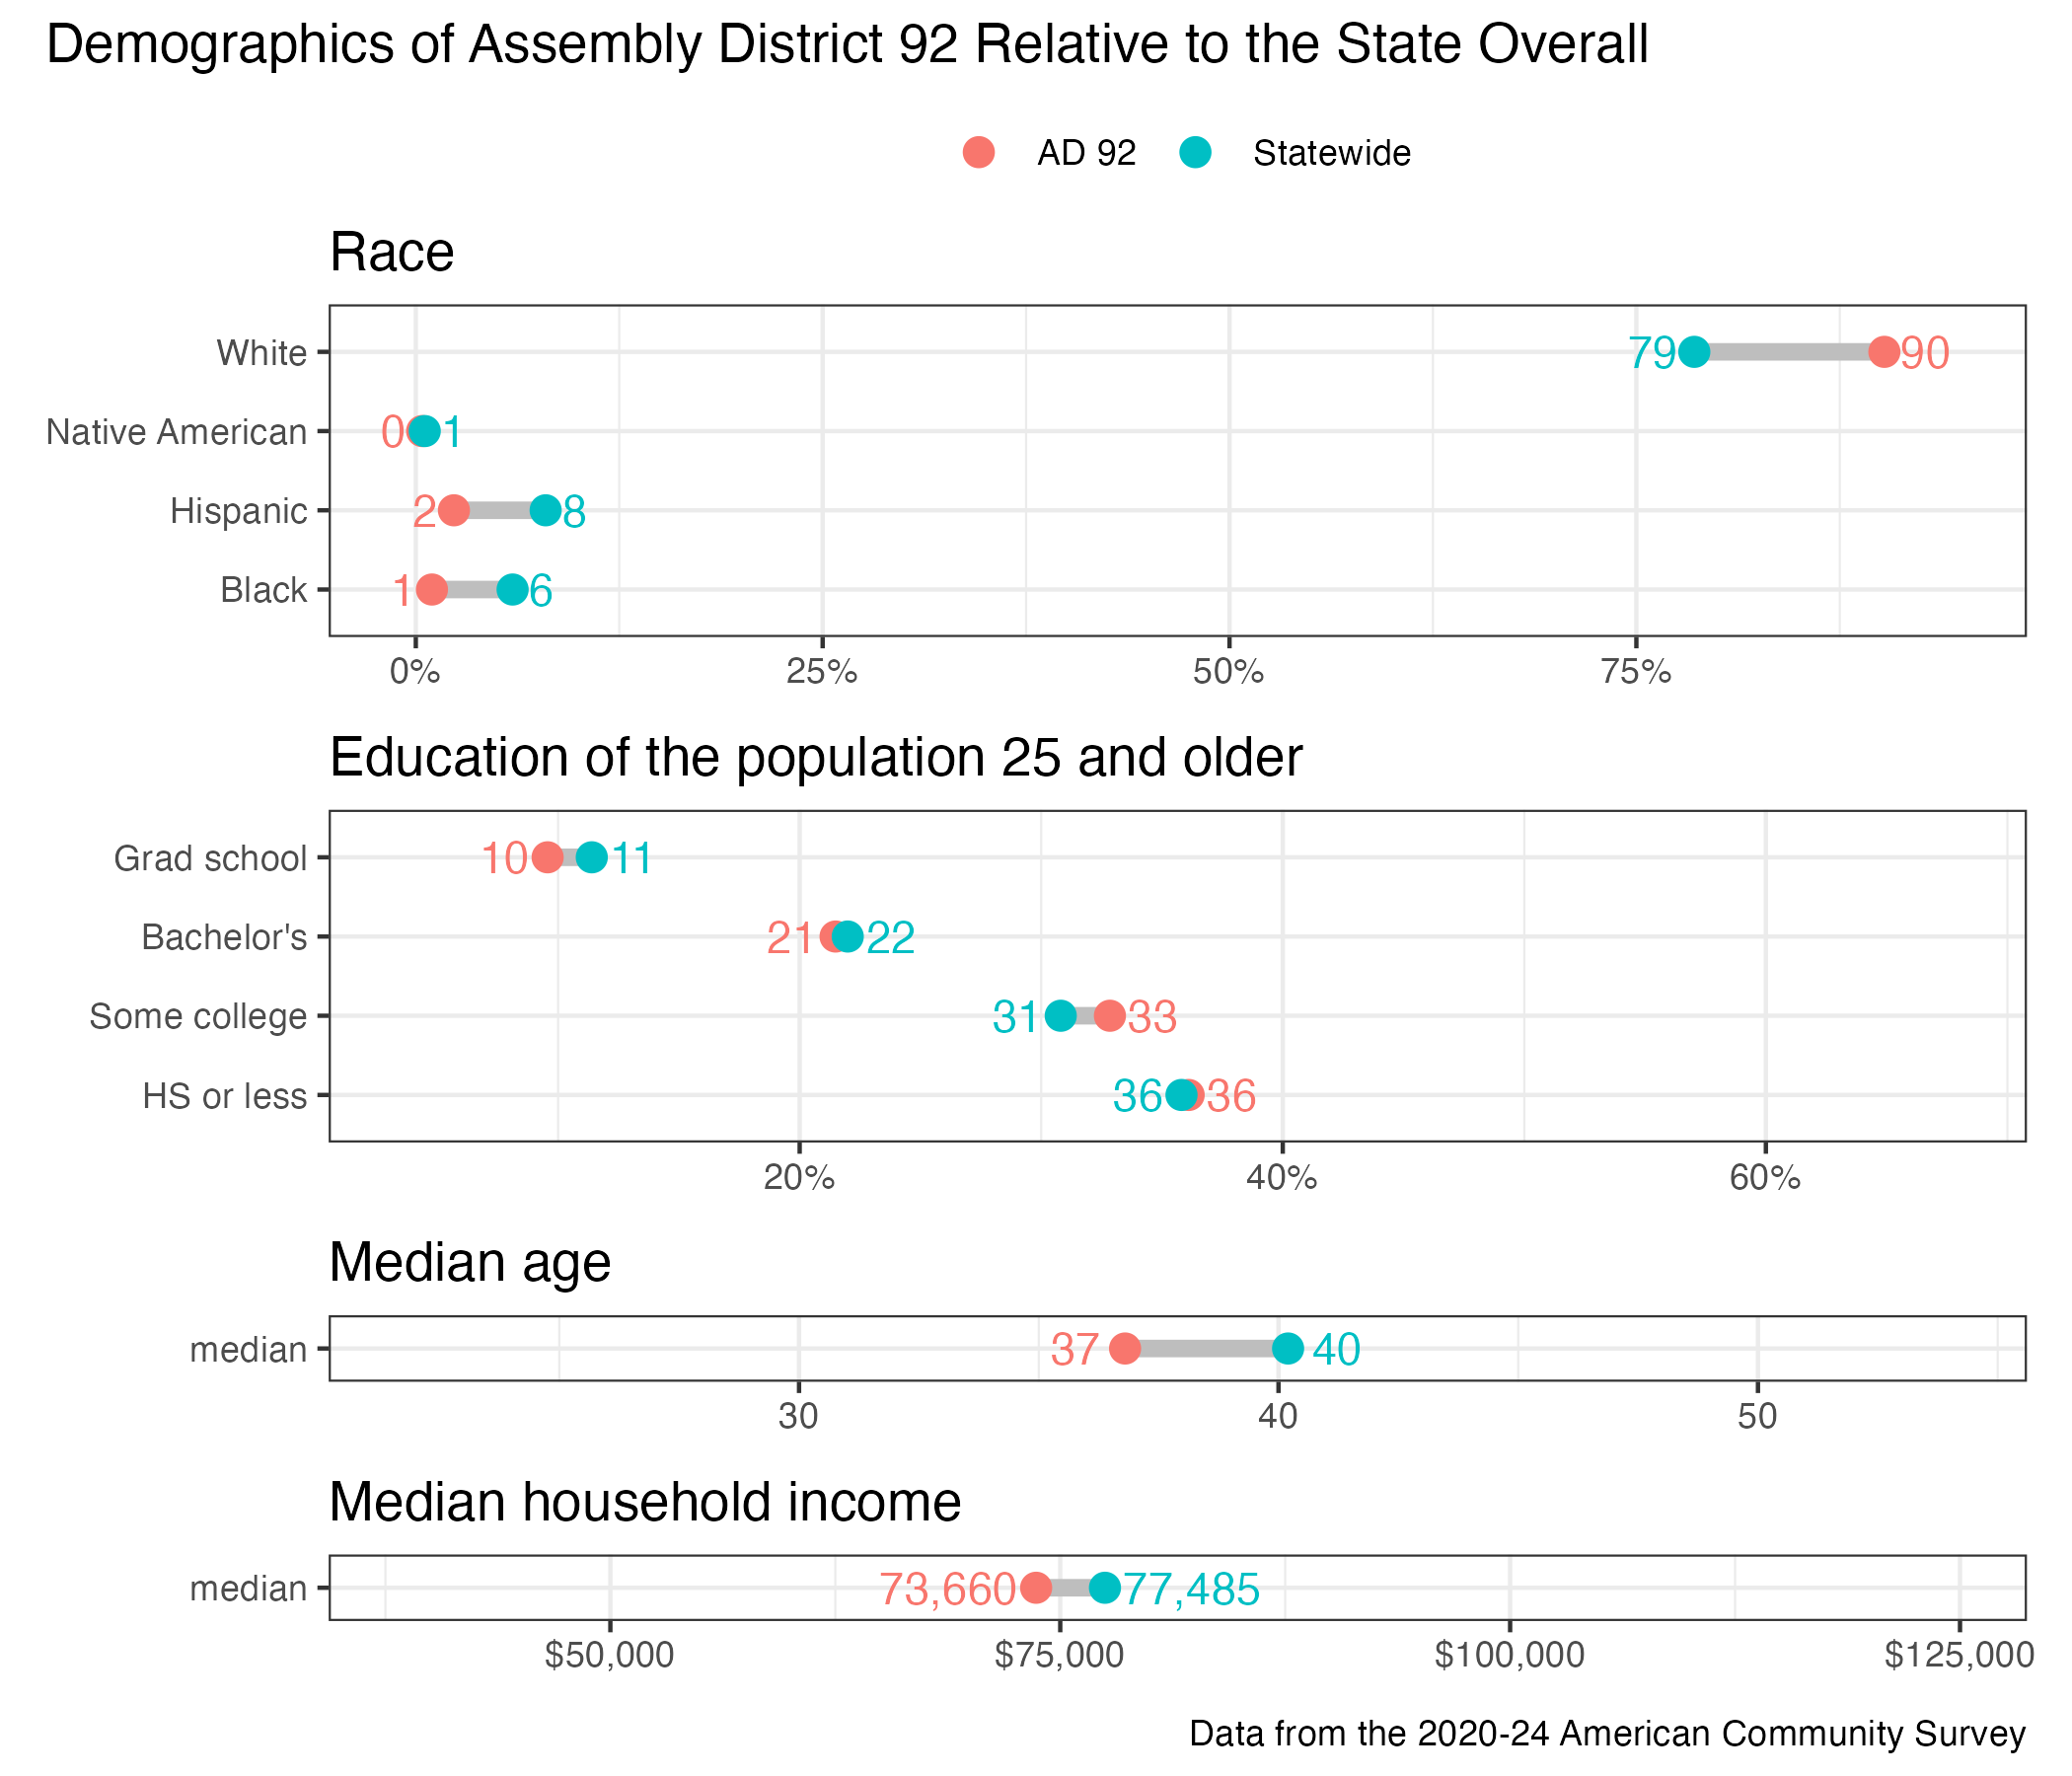
District demographics