20th Assembly District
District
Candidates
| Assembly District 20 Candidates on the Primary Ballot | ||
| Incumbent: Christine M. Sinicki | ||
Jan 1 thru July 30
|
||
|---|---|---|
| receipts | disbursements | |
| Republican | ||
| Kyle Cleary | $2,000.00 | $0.00 |
| Democratic | ||
| Christine M. Sinicki | $14,685.00 | $2,483.09 |
| Data from the 2026 July Continuing Report. Any amended reports might not yet be shown. | ||
Past election results
| Election Results in Wisconsin State Assembly District 20 | ||||||
votes
|
Dem. %1 |
margin (Dem. - Rep.)
|
||||
|---|---|---|---|---|---|---|
| total | Dem. | Rep. | votes | points2 | ||
| 2016 President | 31,531 | 16,852 | 12,446 | 57.5% | +4,406 | +15.0 |
| 2016 Senator | 31,204 | 16,864 | 13,308 | 55.9% | +3,556 | +11.8 |
| 2018 Governor | 28,844 | 16,574 | 11,546 | 58.9% | +5,028 | +17.9 |
| 2018 Senator | 28,658 | 18,174 | 10,410 | 63.6% | +7,764 | +27.2 |
| 2020 President | 33,967 | 19,787 | 13,543 | 59.4% | +6,244 | +18.7 |
| 2022 Governor | 26,880 | 16,831 | 9,744 | 63.3% | +7,087 | +26.7 |
| 2022 Senator | 26,853 | 16,445 | 10,339 | 61.4% | +6,106 | +22.8 |
| 2024 President | 34,013 | 19,921 | 13,517 | 59.6% | +6,404 | +19.2 |
| 2024 Senator | 33,635 | 20,104 | 12,691 | 61.3% | +7,413 | +22.6 |
| 2024 WI Assembly | 32,811 | 20,018 | 12,740 | 61.1% | +7,278 | +22.2 |
| 2025 WI Sup. Ct.3 | 24,092 | 16,352 | 7,723 | 67.9% | +8,629 | +35.8 |
| 1 Share of the two-party vote. For Rep. share, subtract from 100. | ||||||
| 2 Dem % of the two-party vote minus Rep % of the two-party vote | ||||||
| 3 Formally nonpartisan candidates assigned party labels based on state endorsements | ||||||
| Election results allocated into 2024 district boundaries based on population overlap. Calculations by John Johnson (johndjohnson.info). | ||||||
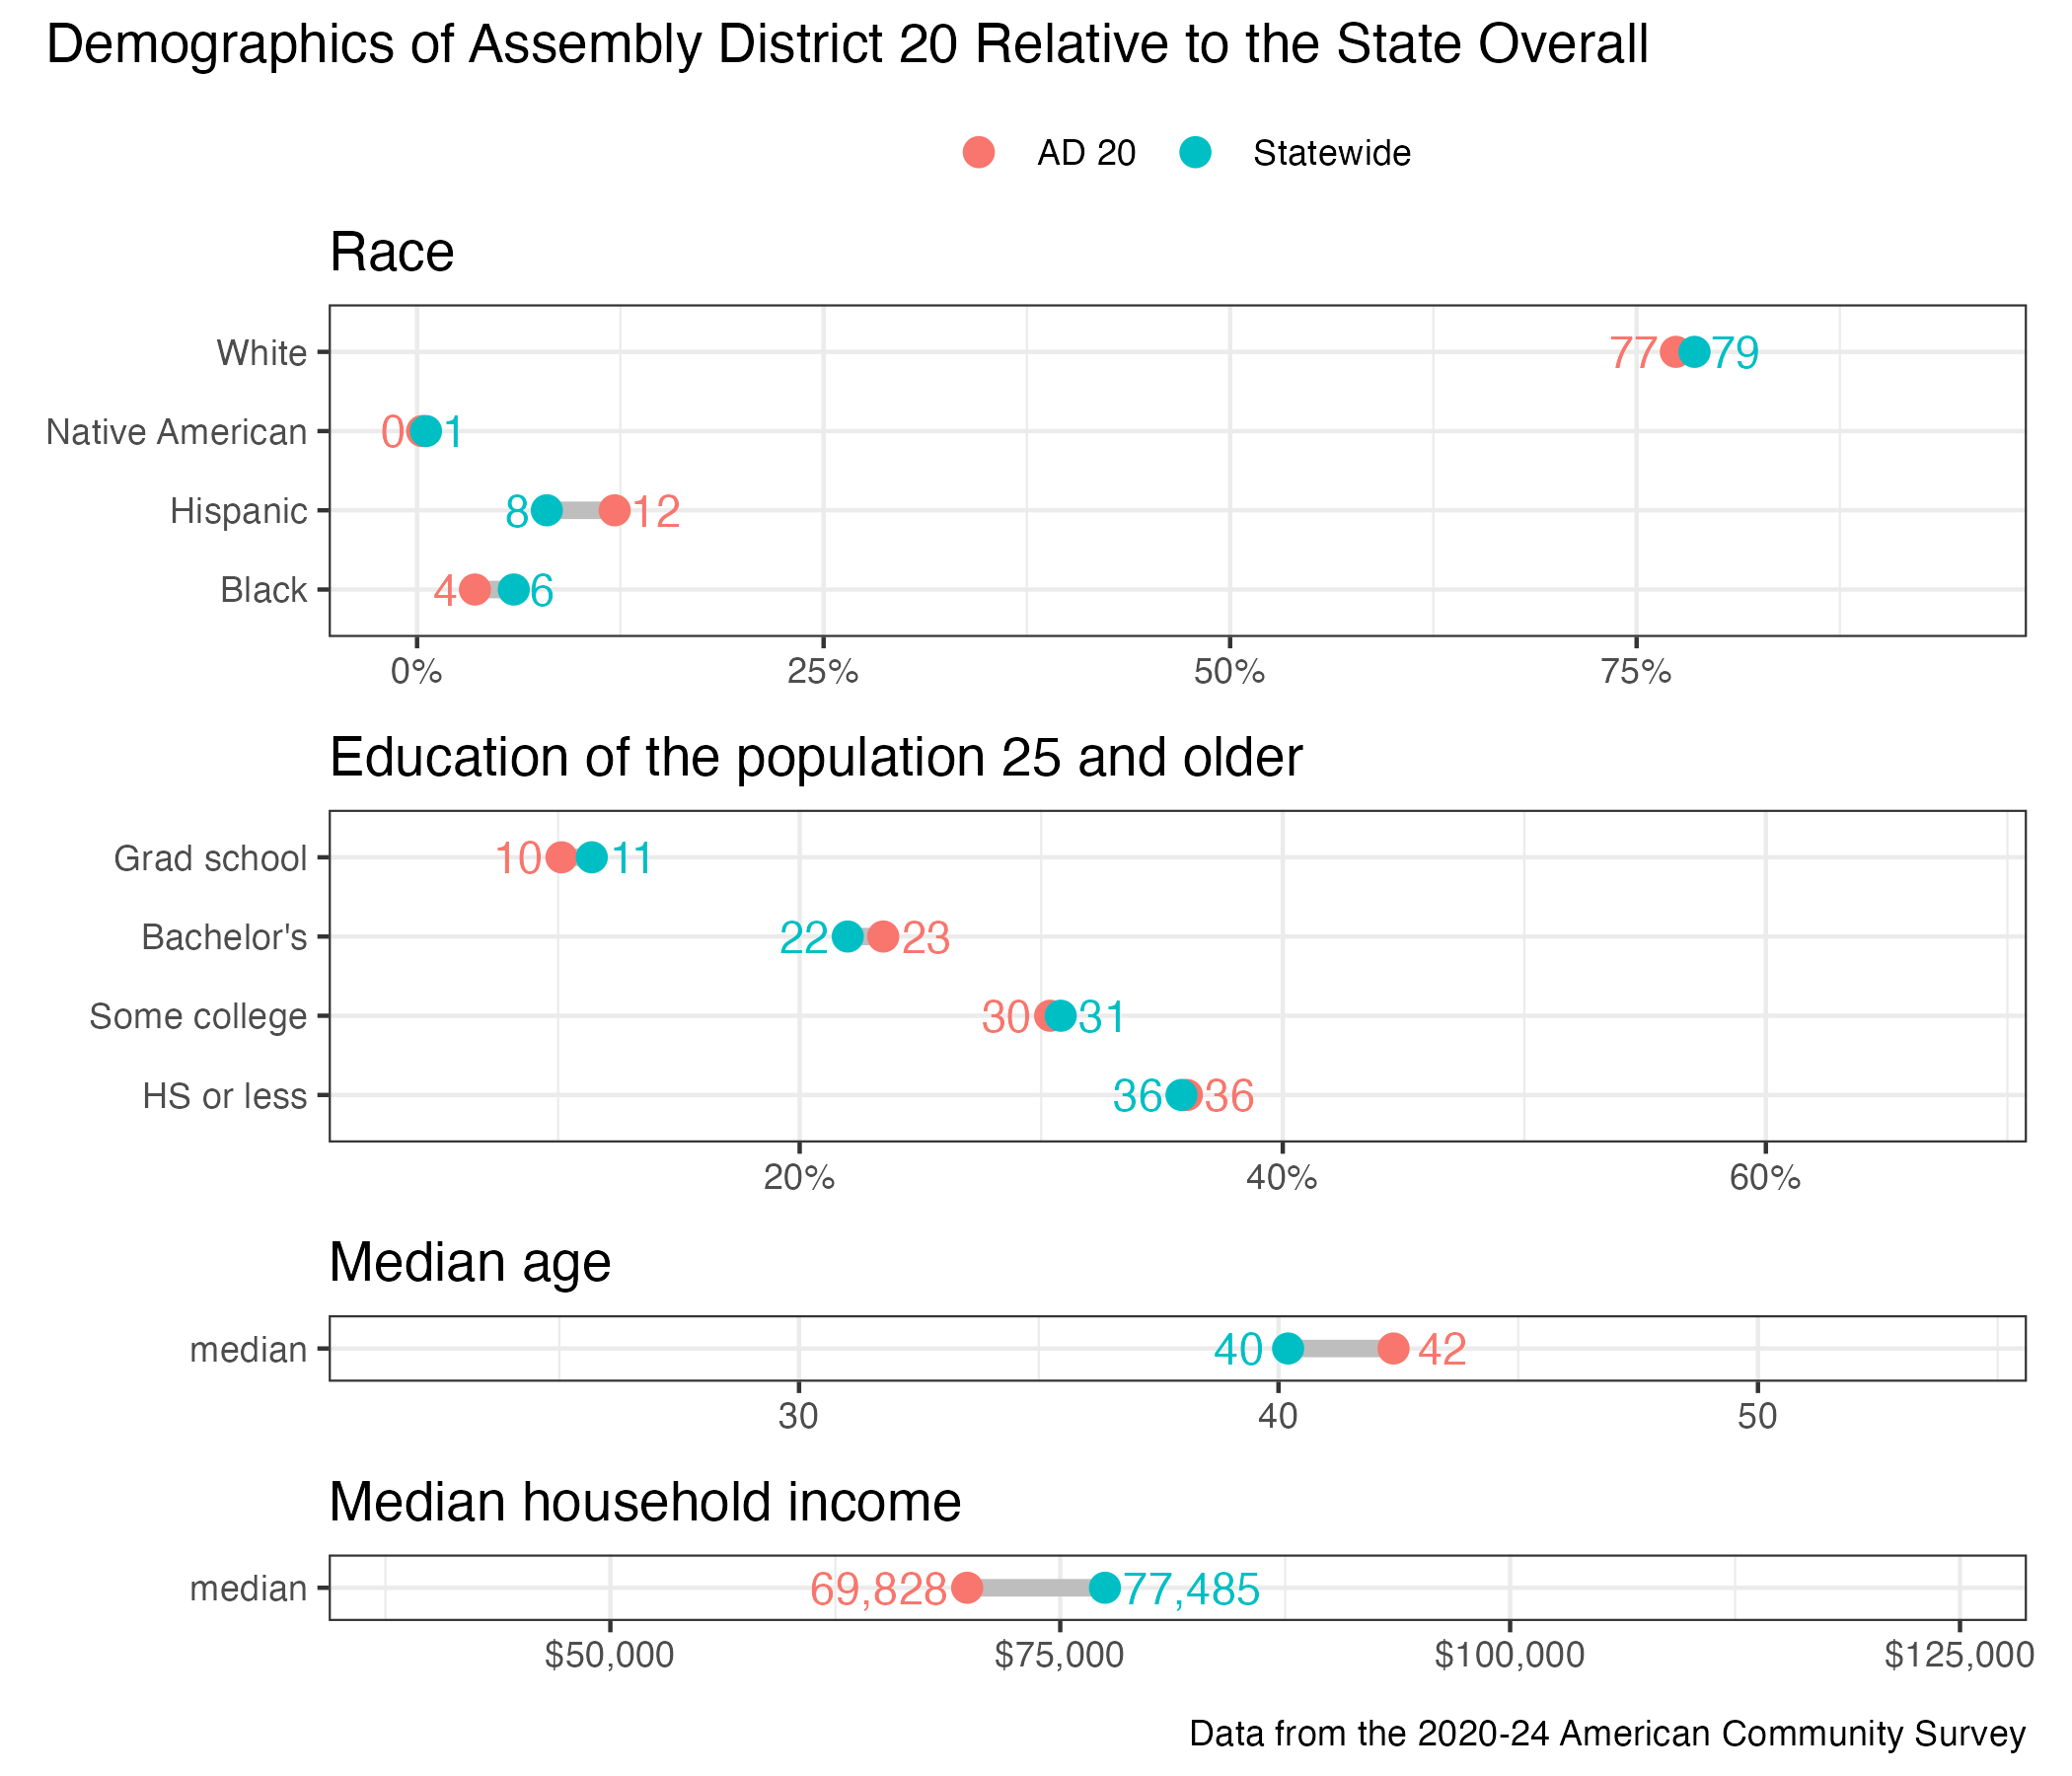
District demographics