5th Senate District
District
Candidates
| Senate District 5 Candidates on the Primary Ballot | ||
| Incumbent: Rob Hutton (Filed Notification of Noncandidacy) | ||
Jan 1 thru July 30
|
||
|---|---|---|
| receipts | disbursements | |
| Republican | ||
| Mike Roberts | $233,299.30 | $29,346.66 |
| Democratic | ||
| Robyn Vining | $169,175.76 | $14,241.73 |
| Data from the 2026 July Continuing Report. Any amended reports might not yet be shown. | ||
Past election results
| Election Results in Wisconsin State Senate District 5 | ||||||
votes
|
Dem. %1 |
margin (Dem. - Rep.)
|
||||
|---|---|---|---|---|---|---|
| total | Dem. | Rep. | votes | points2 | ||
| 2016 President | 99,701 | 43,354 | 49,004 | 46.9% | −5,650 | −6.1 |
| 2016 Senator | 99,519 | 40,132 | 57,256 | 41.2% | −17,124 | −17.6 |
| 2018 Governor | 92,547 | 40,477 | 50,507 | 44.5% | −10,030 | −11.0 |
| 2018 Senator | 92,121 | 45,445 | 46,499 | 49.4% | −1,054 | −1.1 |
| 2020 President | 108,341 | 55,048 | 51,352 | 51.7% | +3,696 | +3.5 |
| 2022 Governor | 89,280 | 46,925 | 41,539 | 53.0% | +5,386 | +6.1 |
| 2022 Senator | 89,145 | 45,055 | 43,869 | 50.7% | +1,186 | +1.3 |
| 2024 President | 110,673 | 57,419 | 50,929 | 53.0% | +6,490 | +6.0 |
| 2024 Senator | 109,789 | 56,646 | 51,201 | 52.5% | +5,445 | +5.0 |
| 2024 NA | NA | NA | NA | NA | NA | NA |
| 2025 WI Sup. Ct.3 | 80,414 | 45,605 | 34,758 | 56.7% | +10,847 | +13.5 |
| 1 Share of the two-party vote. For Rep. share, subtract from 100. | ||||||
| 2 Dem % of the two-party vote minus Rep % of the two-party vote | ||||||
| 3 Formally nonpartisan candidates assigned party labels based on state endorsements | ||||||
| Election results allocated into 2024 district boundaries based on population overlap. Calculations by John Johnson (johndjohnson.info). | ||||||
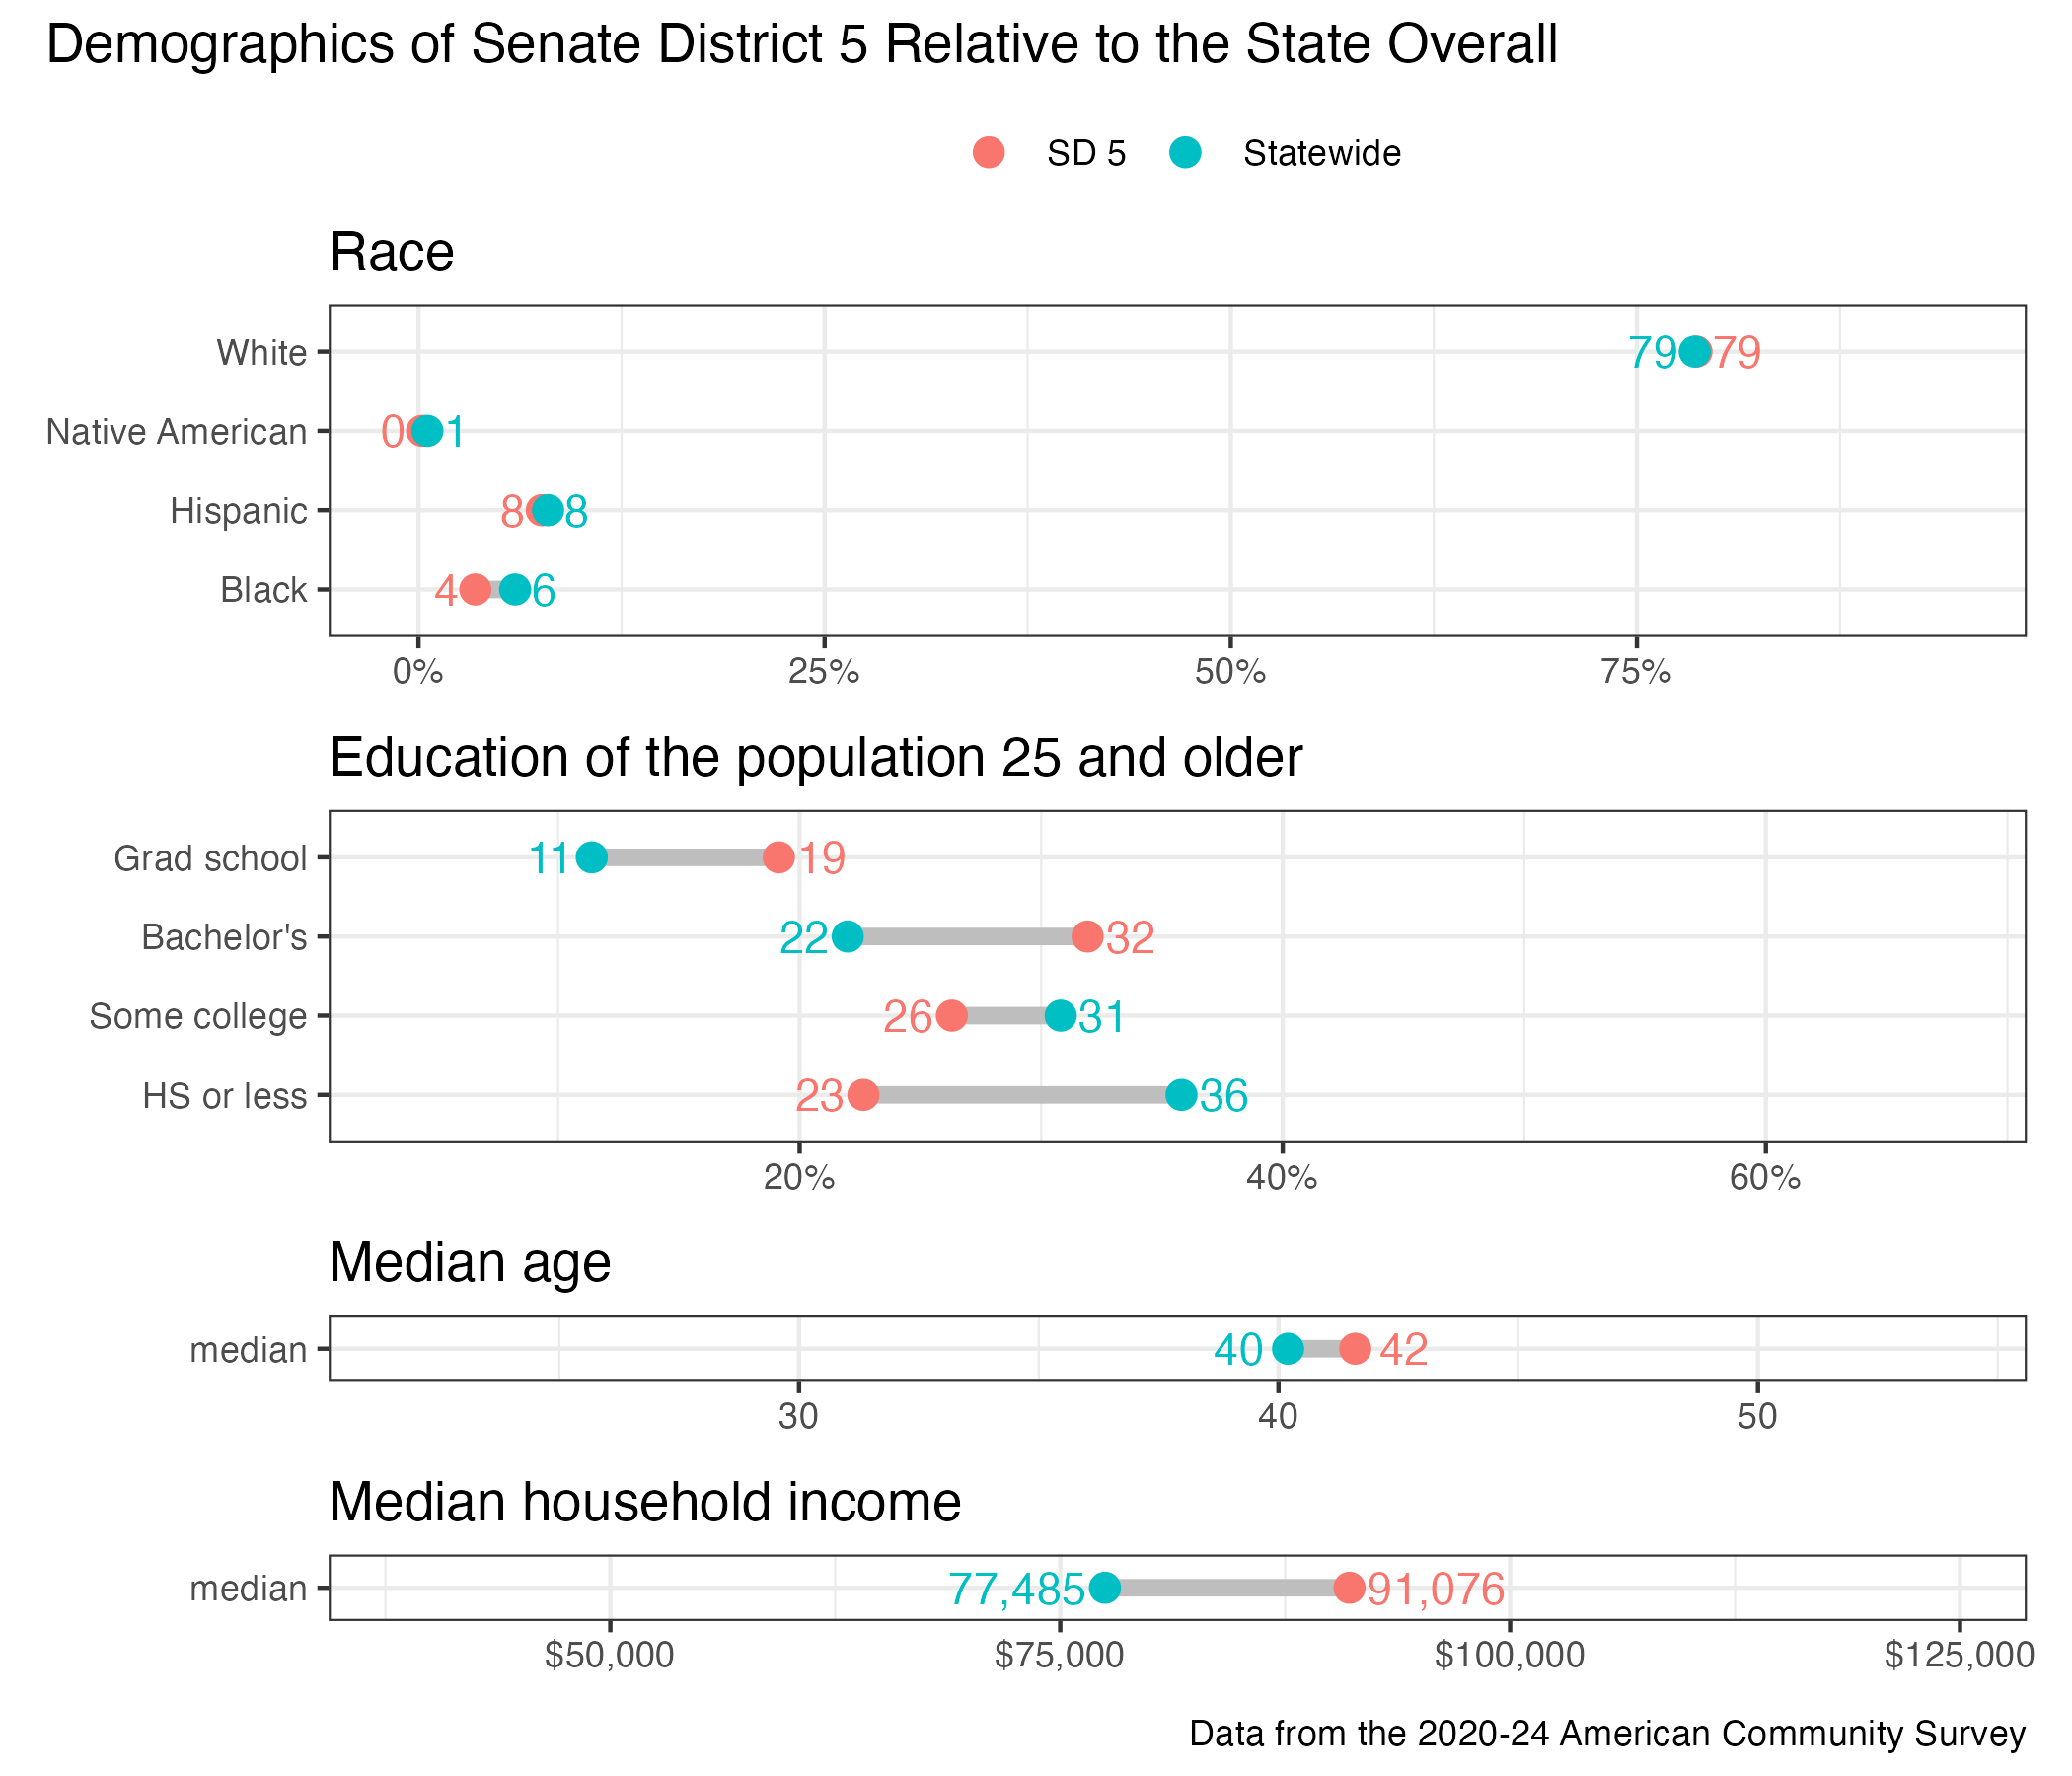
District demographics