52nd Assembly District
District
Candidates
| Assembly District 52 Candidates on the Primary Ballot | ||
| Incumbent: Lee Snodgrass | ||
Jan 1 thru July 30
|
||
|---|---|---|
| receipts | disbursements | |
| Republican | ||
| Reive Pullen | $8,586.24 | $76.00 |
| Democratic | ||
| Lee Snodgrass | $23,938.00 | $6,107.24 |
| Data from the 2026 July Continuing Report. Any amended reports might not yet be shown. | ||
Past election results
| Election Results in Wisconsin State Assembly District 52 | ||||||
votes
|
Dem. %1 |
margin (Dem. - Rep.)
|
||||
|---|---|---|---|---|---|---|
| total | Dem. | Rep. | votes | points2 | ||
| 2016 President | 28,908 | 14,358 | 12,493 | 53.5% | +1,865 | +6.9 |
| 2016 Senator | 28,942 | 13,890 | 13,943 | 49.9% | −53 | −0.2 |
| 2018 Governor | 26,001 | 13,794 | 11,530 | 54.5% | +2,264 | +8.9 |
| 2018 Senator | 25,832 | 15,293 | 10,537 | 59.2% | +4,756 | +18.4 |
| 2020 President | 31,885 | 17,596 | 13,610 | 56.4% | +3,986 | +12.8 |
| 2022 Governor | 25,190 | 14,655 | 10,250 | 58.8% | +4,405 | +17.7 |
| 2022 Senator | 25,070 | 14,150 | 10,920 | 56.4% | +3,230 | +12.9 |
| 2024 President | 31,882 | 18,017 | 13,351 | 57.4% | +4,666 | +14.9 |
| 2024 Senator | 31,587 | 17,860 | 12,887 | 58.1% | +4,973 | +16.2 |
| 2024 WI Assembly | 30,884 | 17,681 | 13,203 | 57.2% | +4,478 | +14.5 |
| 2025 WI Sup. Ct.3 | 21,952 | 13,953 | 7,999 | 63.6% | +5,954 | +27.1 |
| 1 Share of the two-party vote. For Rep. share, subtract from 100. | ||||||
| 2 Dem % of the two-party vote minus Rep % of the two-party vote | ||||||
| 3 Formally nonpartisan candidates assigned party labels based on state endorsements | ||||||
| Election results allocated into 2024 district boundaries based on population overlap. Calculations by John Johnson (johndjohnson.info). | ||||||
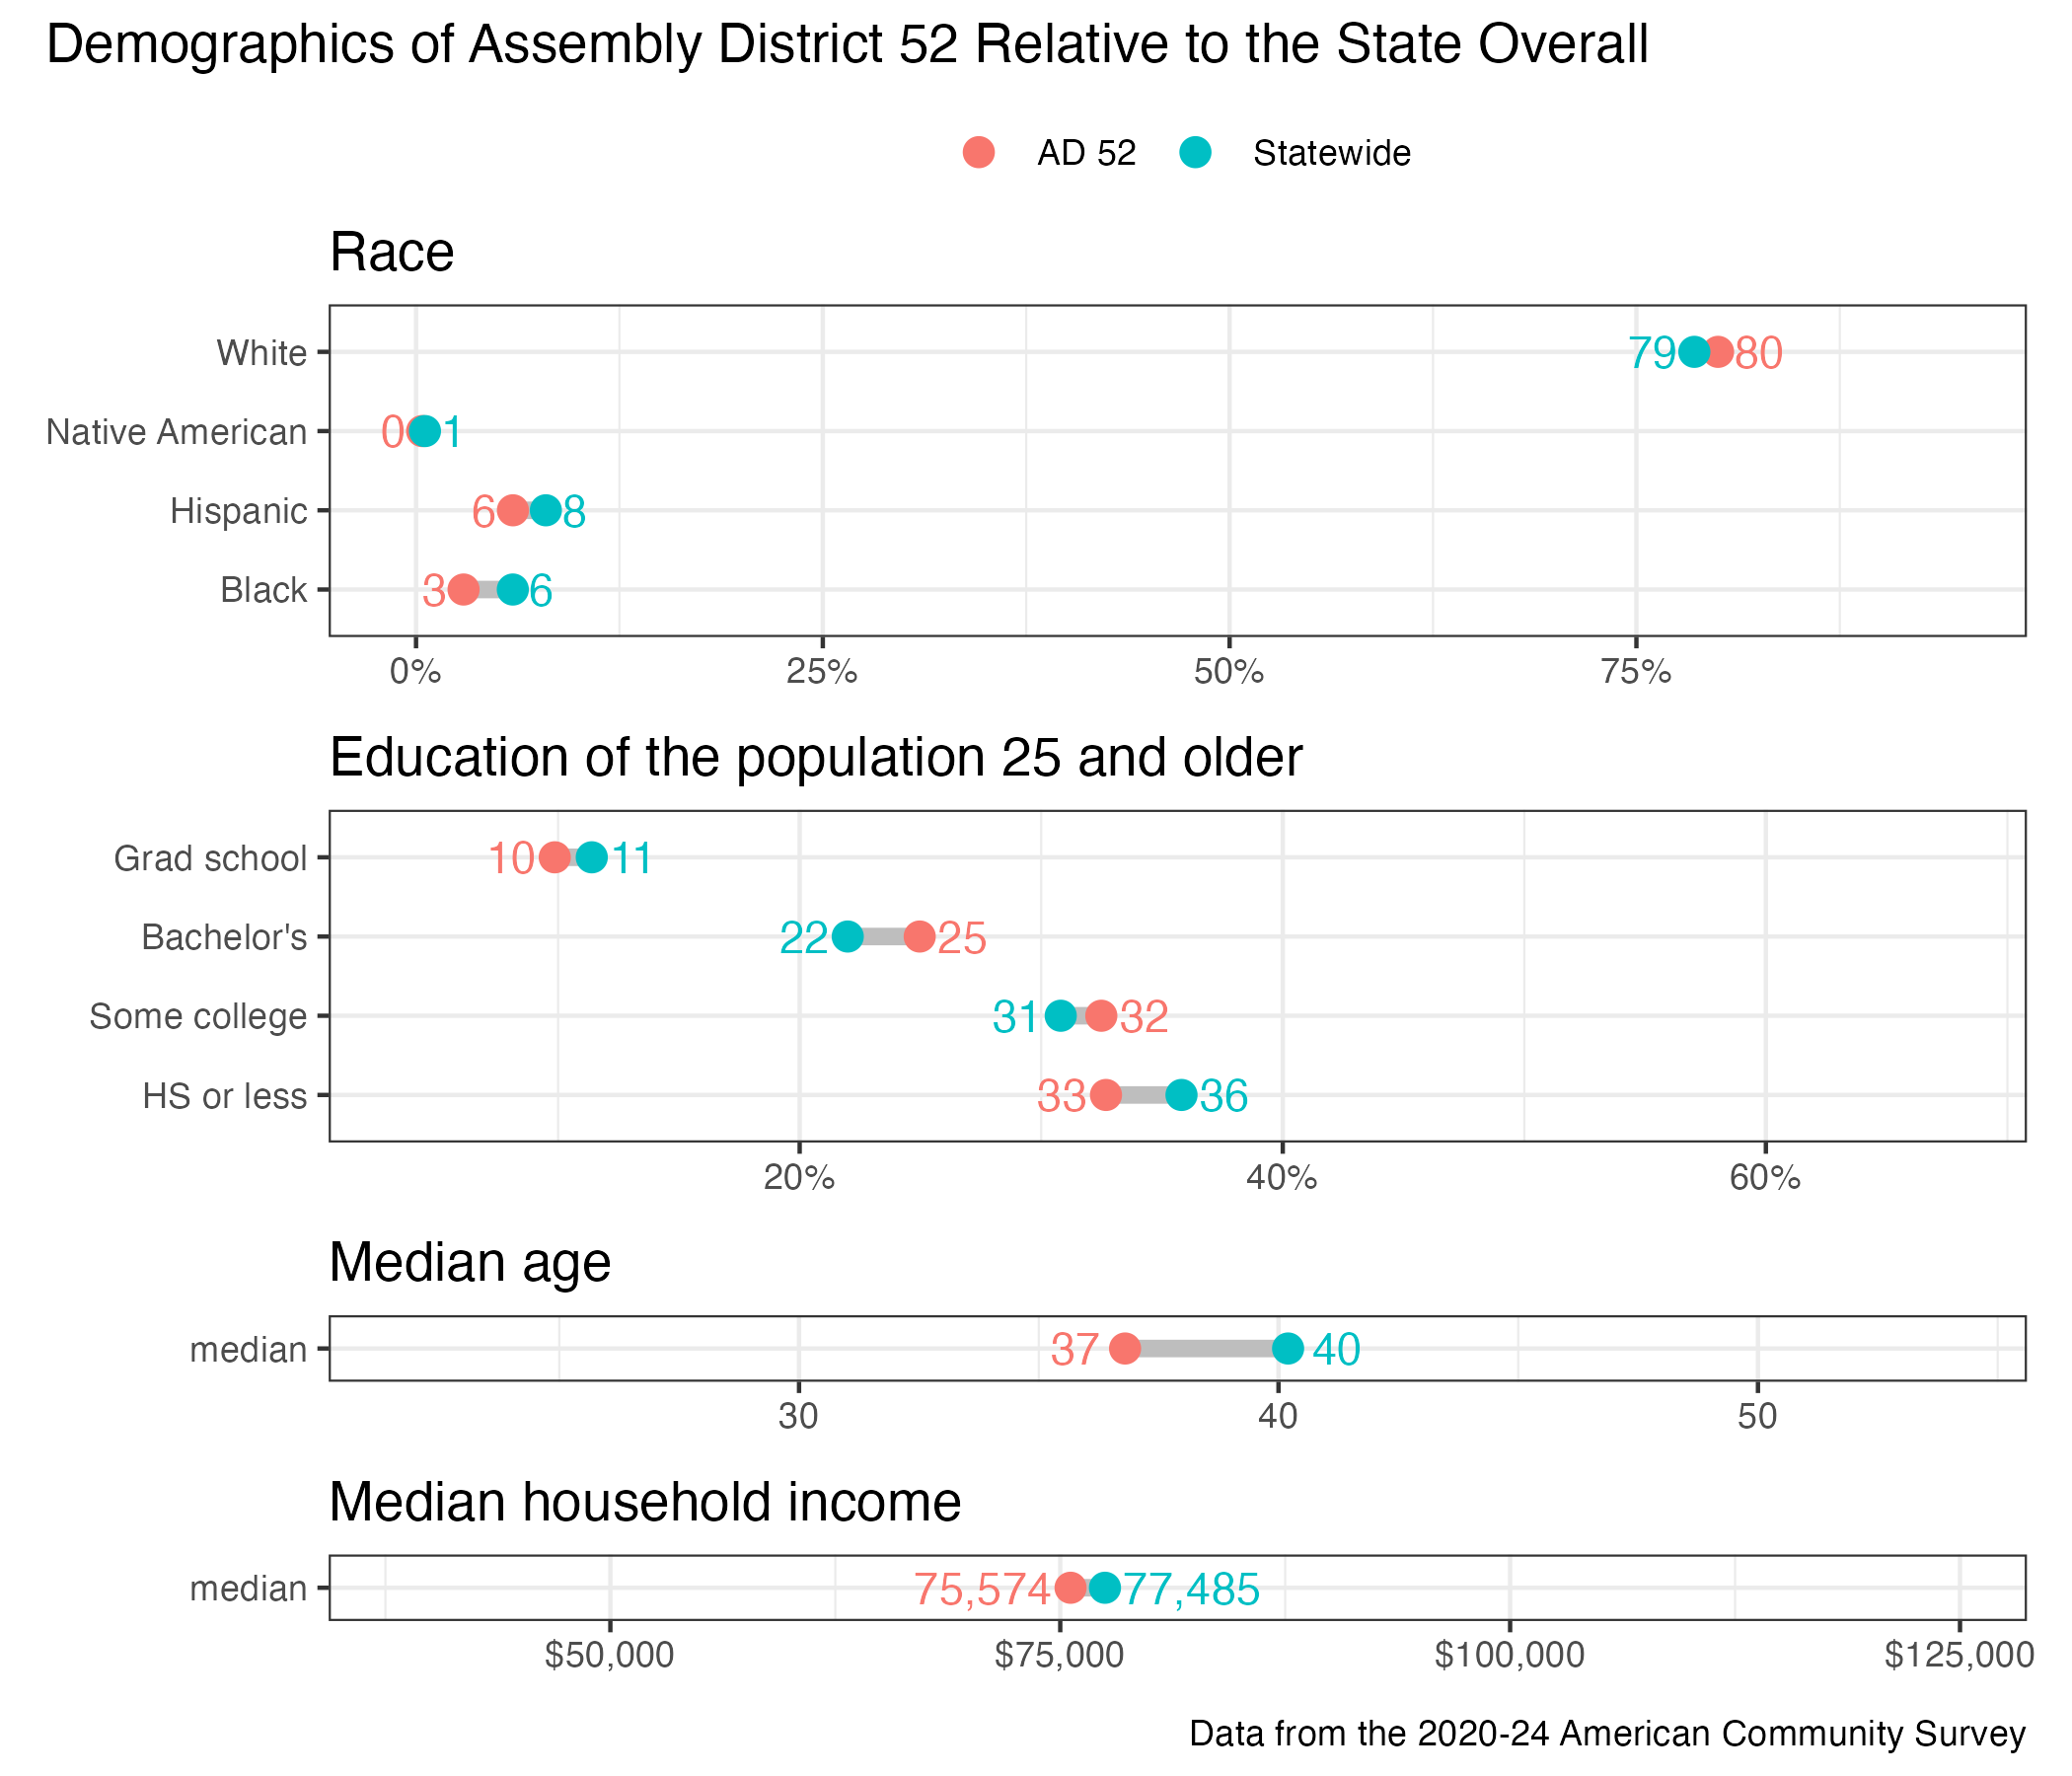
District demographics