61st Assembly District
District
Candidates
| Assembly District 61 Candidates on the Primary Ballot | ||
| Incumbent: Bob Donovan | ||
Jan 1 thru July 30
|
||
|---|---|---|
| receipts | disbursements | |
| Republican | ||
| Bob Donovan | $20,265.00 | $8,065.92 |
| Democratic | ||
| Lawanda Chambers | $21,508.00 | $9,326.77 |
| Ben Brist | $23,844.11 | $4,385.80 |
| Brian Bock | $3,786.75 | $1,096.71 |
| Data from the 2026 July Continuing Report. Any amended reports might not yet be shown. | ||
Past election results
| Election Results in Wisconsin State Assembly District 61 | ||||||
votes
|
Dem. %1 |
margin (Dem. - Rep.)
|
||||
|---|---|---|---|---|---|---|
| total | Dem. | Rep. | votes | points2 | ||
| 2016 President | 31,769 | 14,048 | 15,596 | 47.4% | −1,548 | −5.2 |
| 2016 Senator | 31,581 | 13,390 | 17,506 | 43.3% | −4,116 | −13.3 |
| 2018 Governor | 29,267 | 13,320 | 15,411 | 46.4% | −2,091 | −7.3 |
| 2018 Senator | 29,057 | 15,062 | 13,945 | 51.9% | +1,117 | +3.9 |
| 2020 President | 34,863 | 17,492 | 16,844 | 50.9% | +648 | +1.9 |
| 2022 Governor | 27,331 | 14,326 | 12,750 | 52.9% | +1,576 | +5.8 |
| 2022 Senator | 27,276 | 13,720 | 13,500 | 50.4% | +220 | +0.8 |
| 2024 President | 34,966 | 17,476 | 16,705 | 51.1% | +771 | +2.3 |
| 2024 Senator | 34,496 | 17,524 | 16,259 | 51.9% | +1,265 | +3.7 |
| 2024 WI Assembly | 34,183 | 16,511 | 17,618 | 48.4% | −1,107 | −3.2 |
| 2025 WI Sup. Ct.3 | 23,981 | 13,599 | 10,369 | 56.7% | +3,230 | +13.5 |
| 1 Share of the two-party vote. For Rep. share, subtract from 100. | ||||||
| 2 Dem % of the two-party vote minus Rep % of the two-party vote | ||||||
| 3 Formally nonpartisan candidates assigned party labels based on state endorsements | ||||||
| Election results allocated into 2024 district boundaries based on population overlap. Calculations by John Johnson (johndjohnson.info). | ||||||
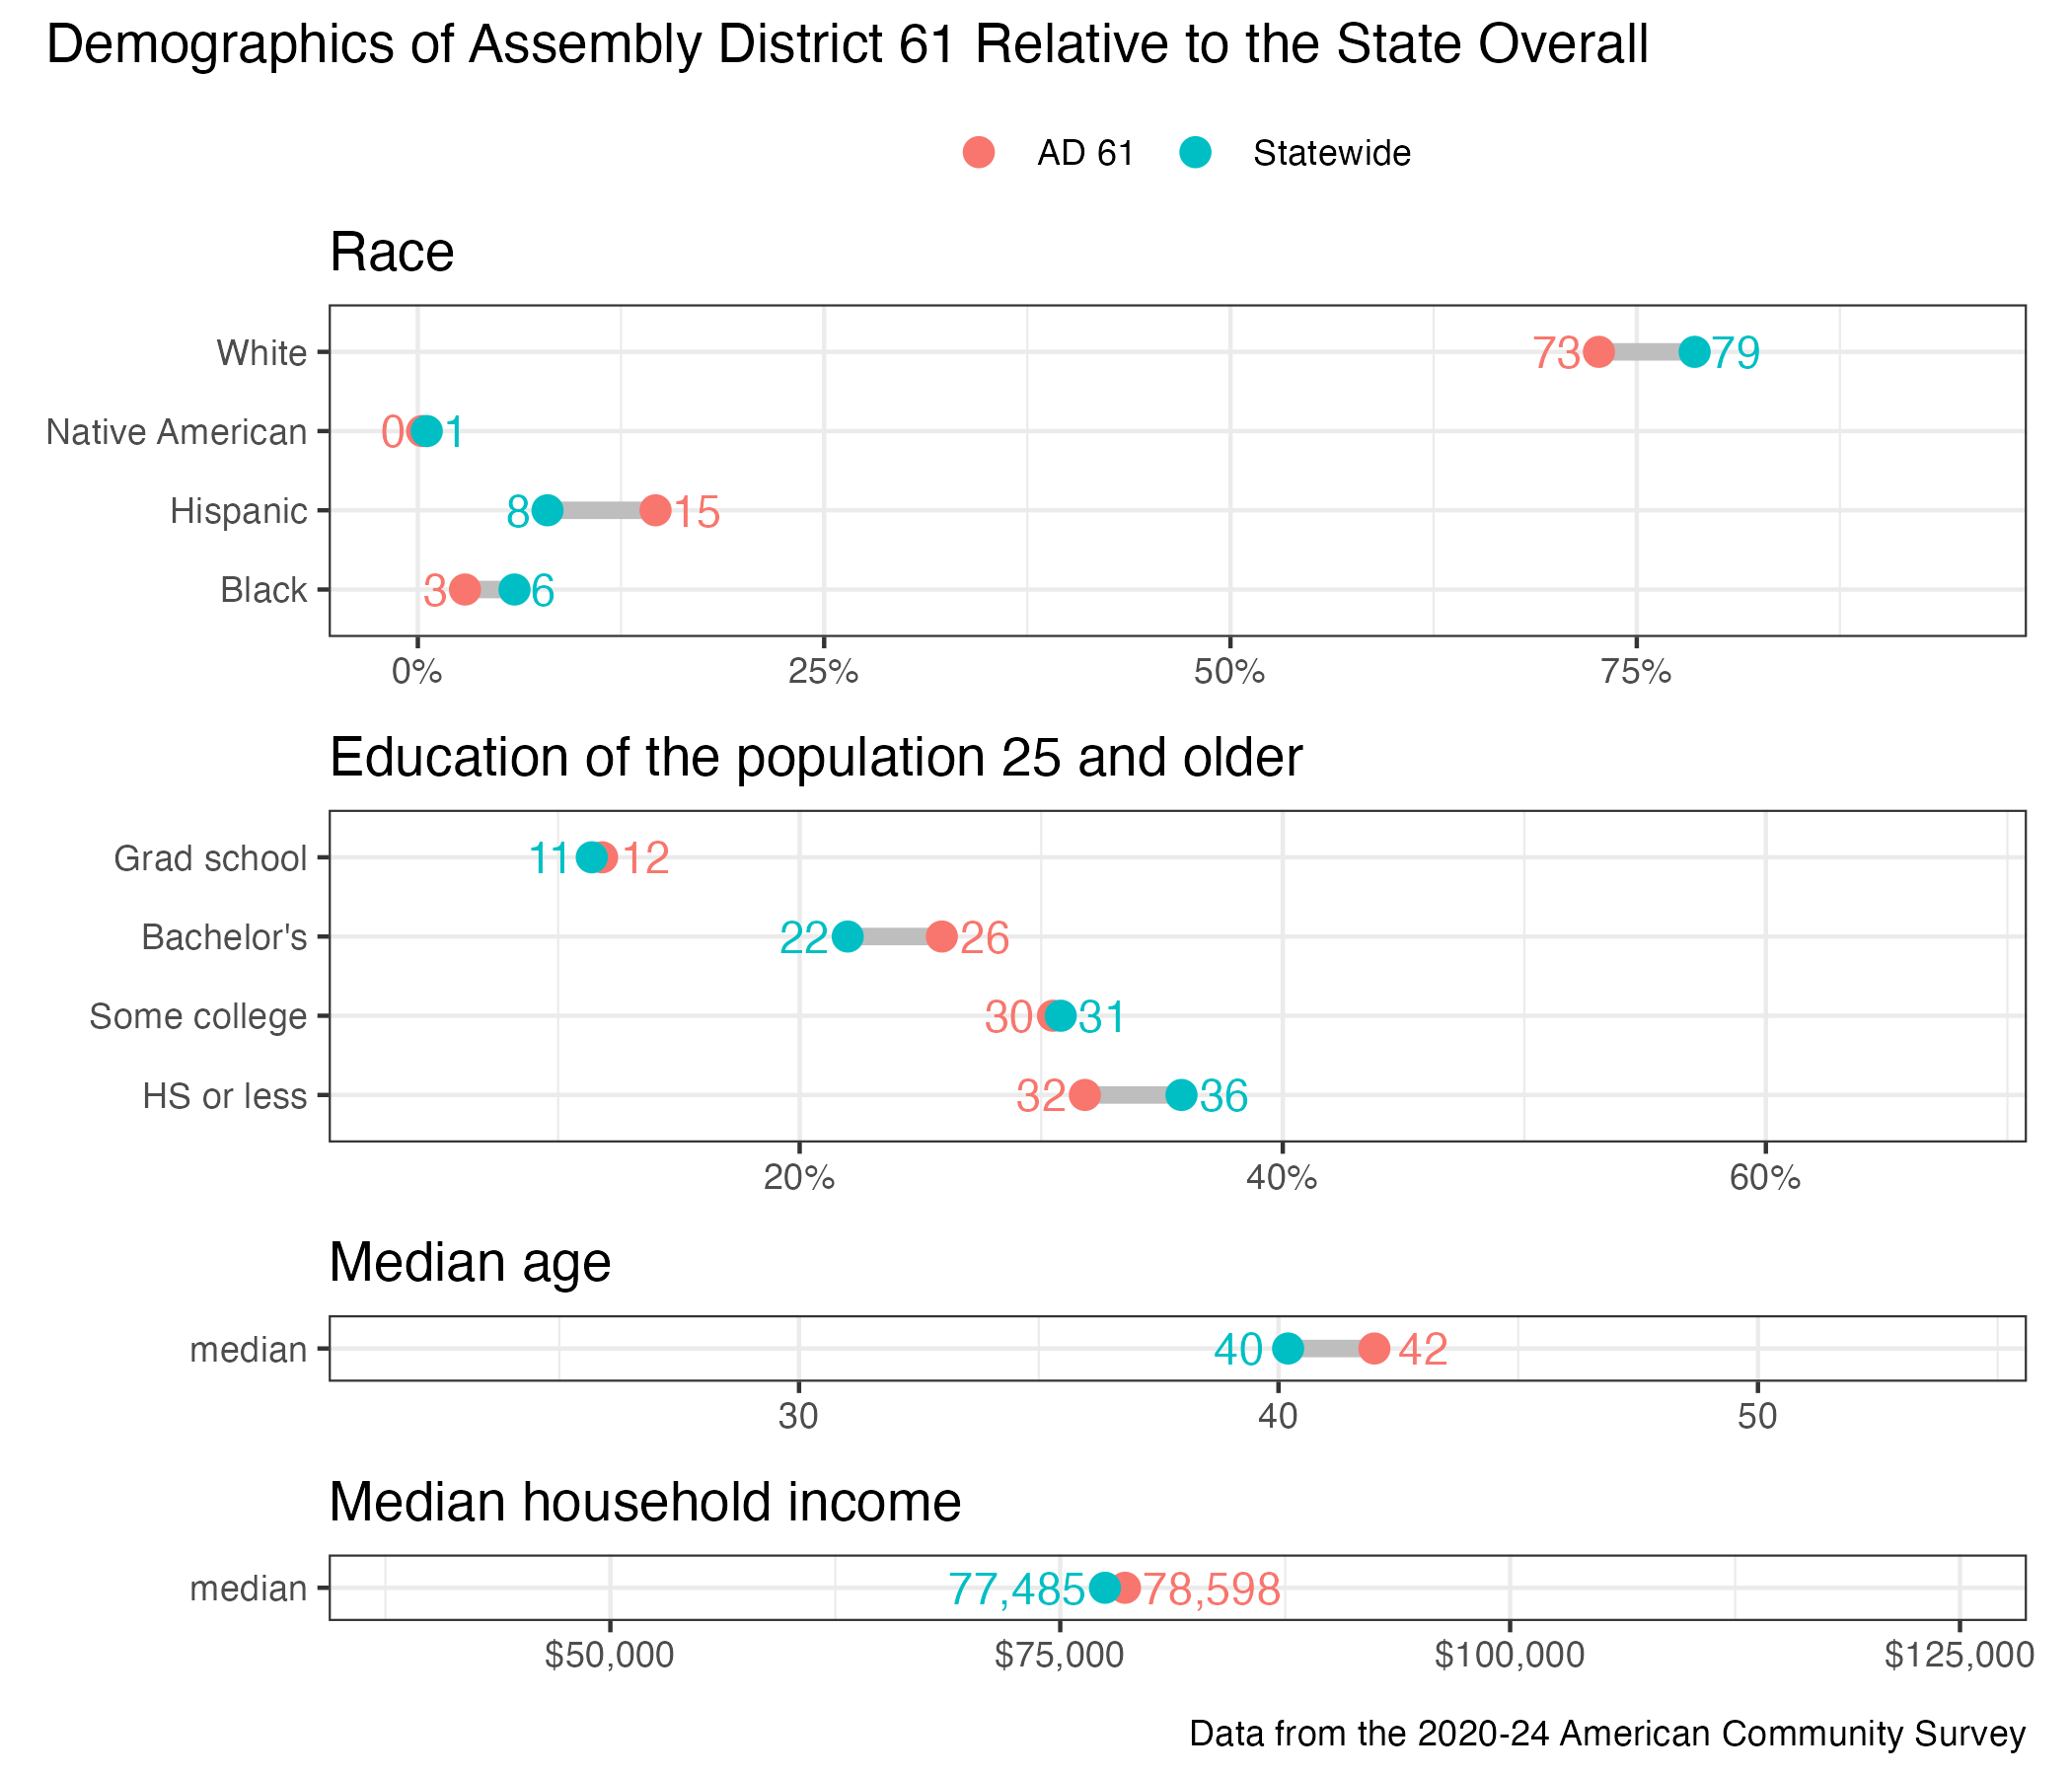
District demographics