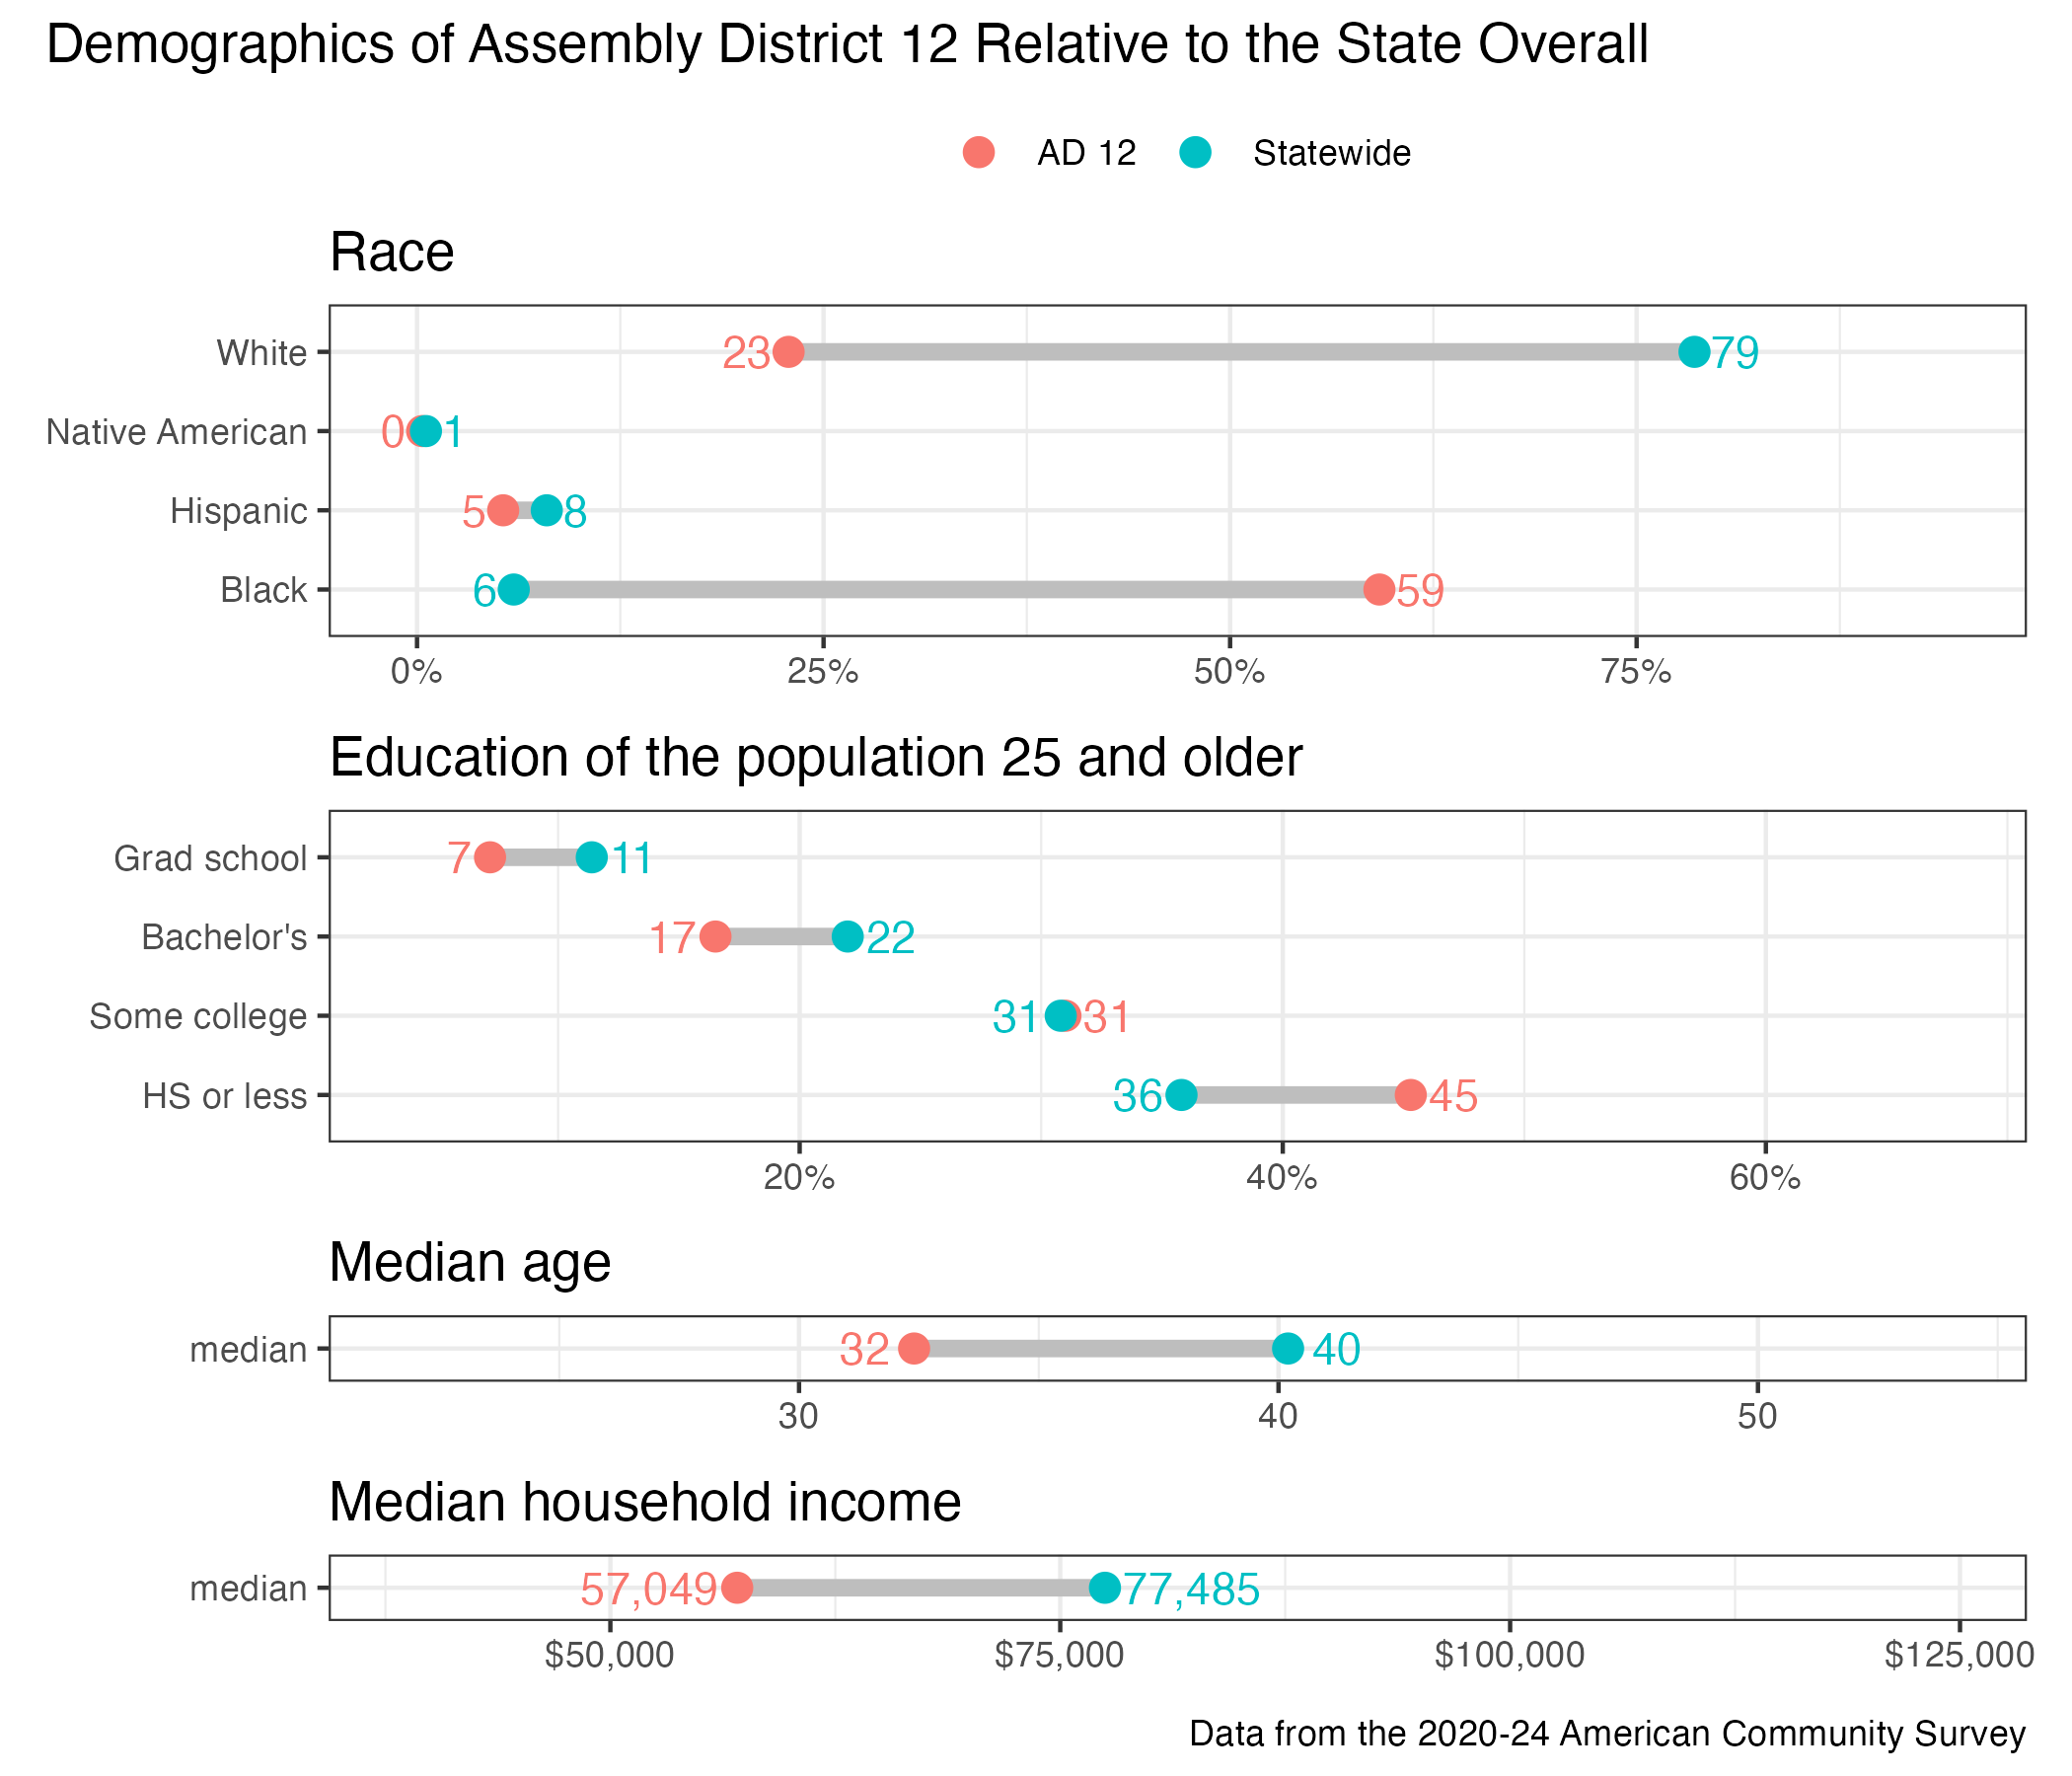
12th Assembly District
District
Candidates
| Assembly District 12 Candidates on the Primary Ballot | ||
| Incumbent: Russell Antonio Goodwin, Sr. | ||
Jan 1 thru July 30
|
||
|---|---|---|
| receipts | disbursements | |
| Democratic | ||
| Russell Antonio Goodwin, Sr. | $4,854.04 | $2,174.44 |
| Jordan Roman | $18,587.46 | $14,098.83 |
| Data from the 2026 July Continuing Report. Any amended reports might not yet be shown. | ||
Past election results
| Election Results in Wisconsin State Assembly District 12 | ||||||
votes
|
Dem. %1 |
margin (Dem. - Rep.)
|
||||
|---|---|---|---|---|---|---|
| total | Dem. | Rep. | votes | points2 | ||
| 2016 President | 25,990 | 19,580 | 5,349 | 78.5% | +14,231 | +57.1 |
| 2016 Senator | 25,597 | 18,824 | 6,247 | 75.1% | +12,577 | +50.2 |
| 2018 Governor | 22,130 | 16,889 | 4,877 | 77.6% | +12,012 | +55.2 |
| 2018 Senator | 22,134 | 17,744 | 4,348 | 80.3% | +13,396 | +60.6 |
| 2020 President | 26,026 | 20,294 | 5,320 | 79.2% | +14,974 | +58.5 |
| 2022 Governor | 17,723 | 14,062 | 3,493 | 80.1% | +10,569 | +60.2 |
| 2022 Senator | 17,890 | 14,136 | 3,723 | 79.2% | +10,413 | +58.3 |
| 2024 President | 25,554 | 20,191 | 4,959 | 80.3% | +15,232 | +60.6 |
| 2024 Senator | 25,184 | 20,012 | 4,610 | 81.3% | +15,402 | +62.6 |
| 2024 WI Assembly | 22,856 | 18,391 | 0 | 100.0% | +18,391 | +100.0 |
| 2025 WI Sup. Ct.3 | 14,989 | 12,169 | 2,807 | 81.3% | +9,362 | +62.5 |
| 1 Share of the two-party vote. For Rep. share, subtract from 100. | ||||||
| 2 Dem % of the two-party vote minus Rep % of the two-party vote | ||||||
| 3 Formally nonpartisan candidates assigned party labels based on state endorsements | ||||||
| Election results allocated into 2024 district boundaries based on population overlap. Calculations by John Johnson (johndjohnson.info). | ||||||
District demographics