85th Assembly District
District
Candidates
| Assembly District 85 Candidates on the Primary Ballot | ||
| Incumbent: Patrick Snyder | ||
Jan 1 thru July 30
|
||
|---|---|---|
| receipts | disbursements | |
| Republican | ||
| Patrick Snyder | $25,885.00 | $3,531.55 |
| Democratic | ||
| John Kroll | $63,648.91 | $0.00 |
| Data from the 2026 July Continuing Report. Any amended reports might not yet be shown. | ||
Past election results
| Election Results in Wisconsin State Assembly District 85 | ||||||
votes
|
Dem. %1 |
margin (Dem. - Rep.)
|
||||
|---|---|---|---|---|---|---|
| total | Dem. | Rep. | votes | points2 | ||
| 2016 President | 27,225 | 12,236 | 13,181 | 48.1% | −945 | −3.7 |
| 2016 Senator | 26,963 | 12,561 | 13,370 | 48.4% | −809 | −3.1 |
| 2018 Governor | 24,324 | 11,128 | 12,631 | 46.8% | −1,503 | −6.3 |
| 2018 Senator | 24,223 | 12,958 | 11,236 | 53.6% | +1,722 | +7.1 |
| 2020 President | 29,740 | 14,493 | 14,630 | 49.8% | −137 | −0.5 |
| 2022 Governor | 22,881 | 11,436 | 11,153 | 50.6% | +283 | +1.3 |
| 2022 Senator | 22,818 | 10,986 | 11,786 | 48.2% | −800 | −3.5 |
| 2024 President | 29,970 | 14,658 | 14,838 | 49.7% | −180 | −0.6 |
| 2024 Senator | 29,718 | 14,672 | 14,383 | 50.5% | +289 | +1.0 |
| 2024 WI Assembly | 29,410 | 13,736 | 15,636 | 46.8% | −1,900 | −6.5 |
| 2025 WI Sup. Ct.3 | 19,992 | 10,883 | 9,099 | 54.5% | +1,784 | +8.9 |
| 1 Share of the two-party vote. For Rep. share, subtract from 100. | ||||||
| 2 Dem % of the two-party vote minus Rep % of the two-party vote | ||||||
| 3 Formally nonpartisan candidates assigned party labels based on state endorsements | ||||||
| Election results allocated into 2024 district boundaries based on population overlap. Calculations by John Johnson (johndjohnson.info). | ||||||
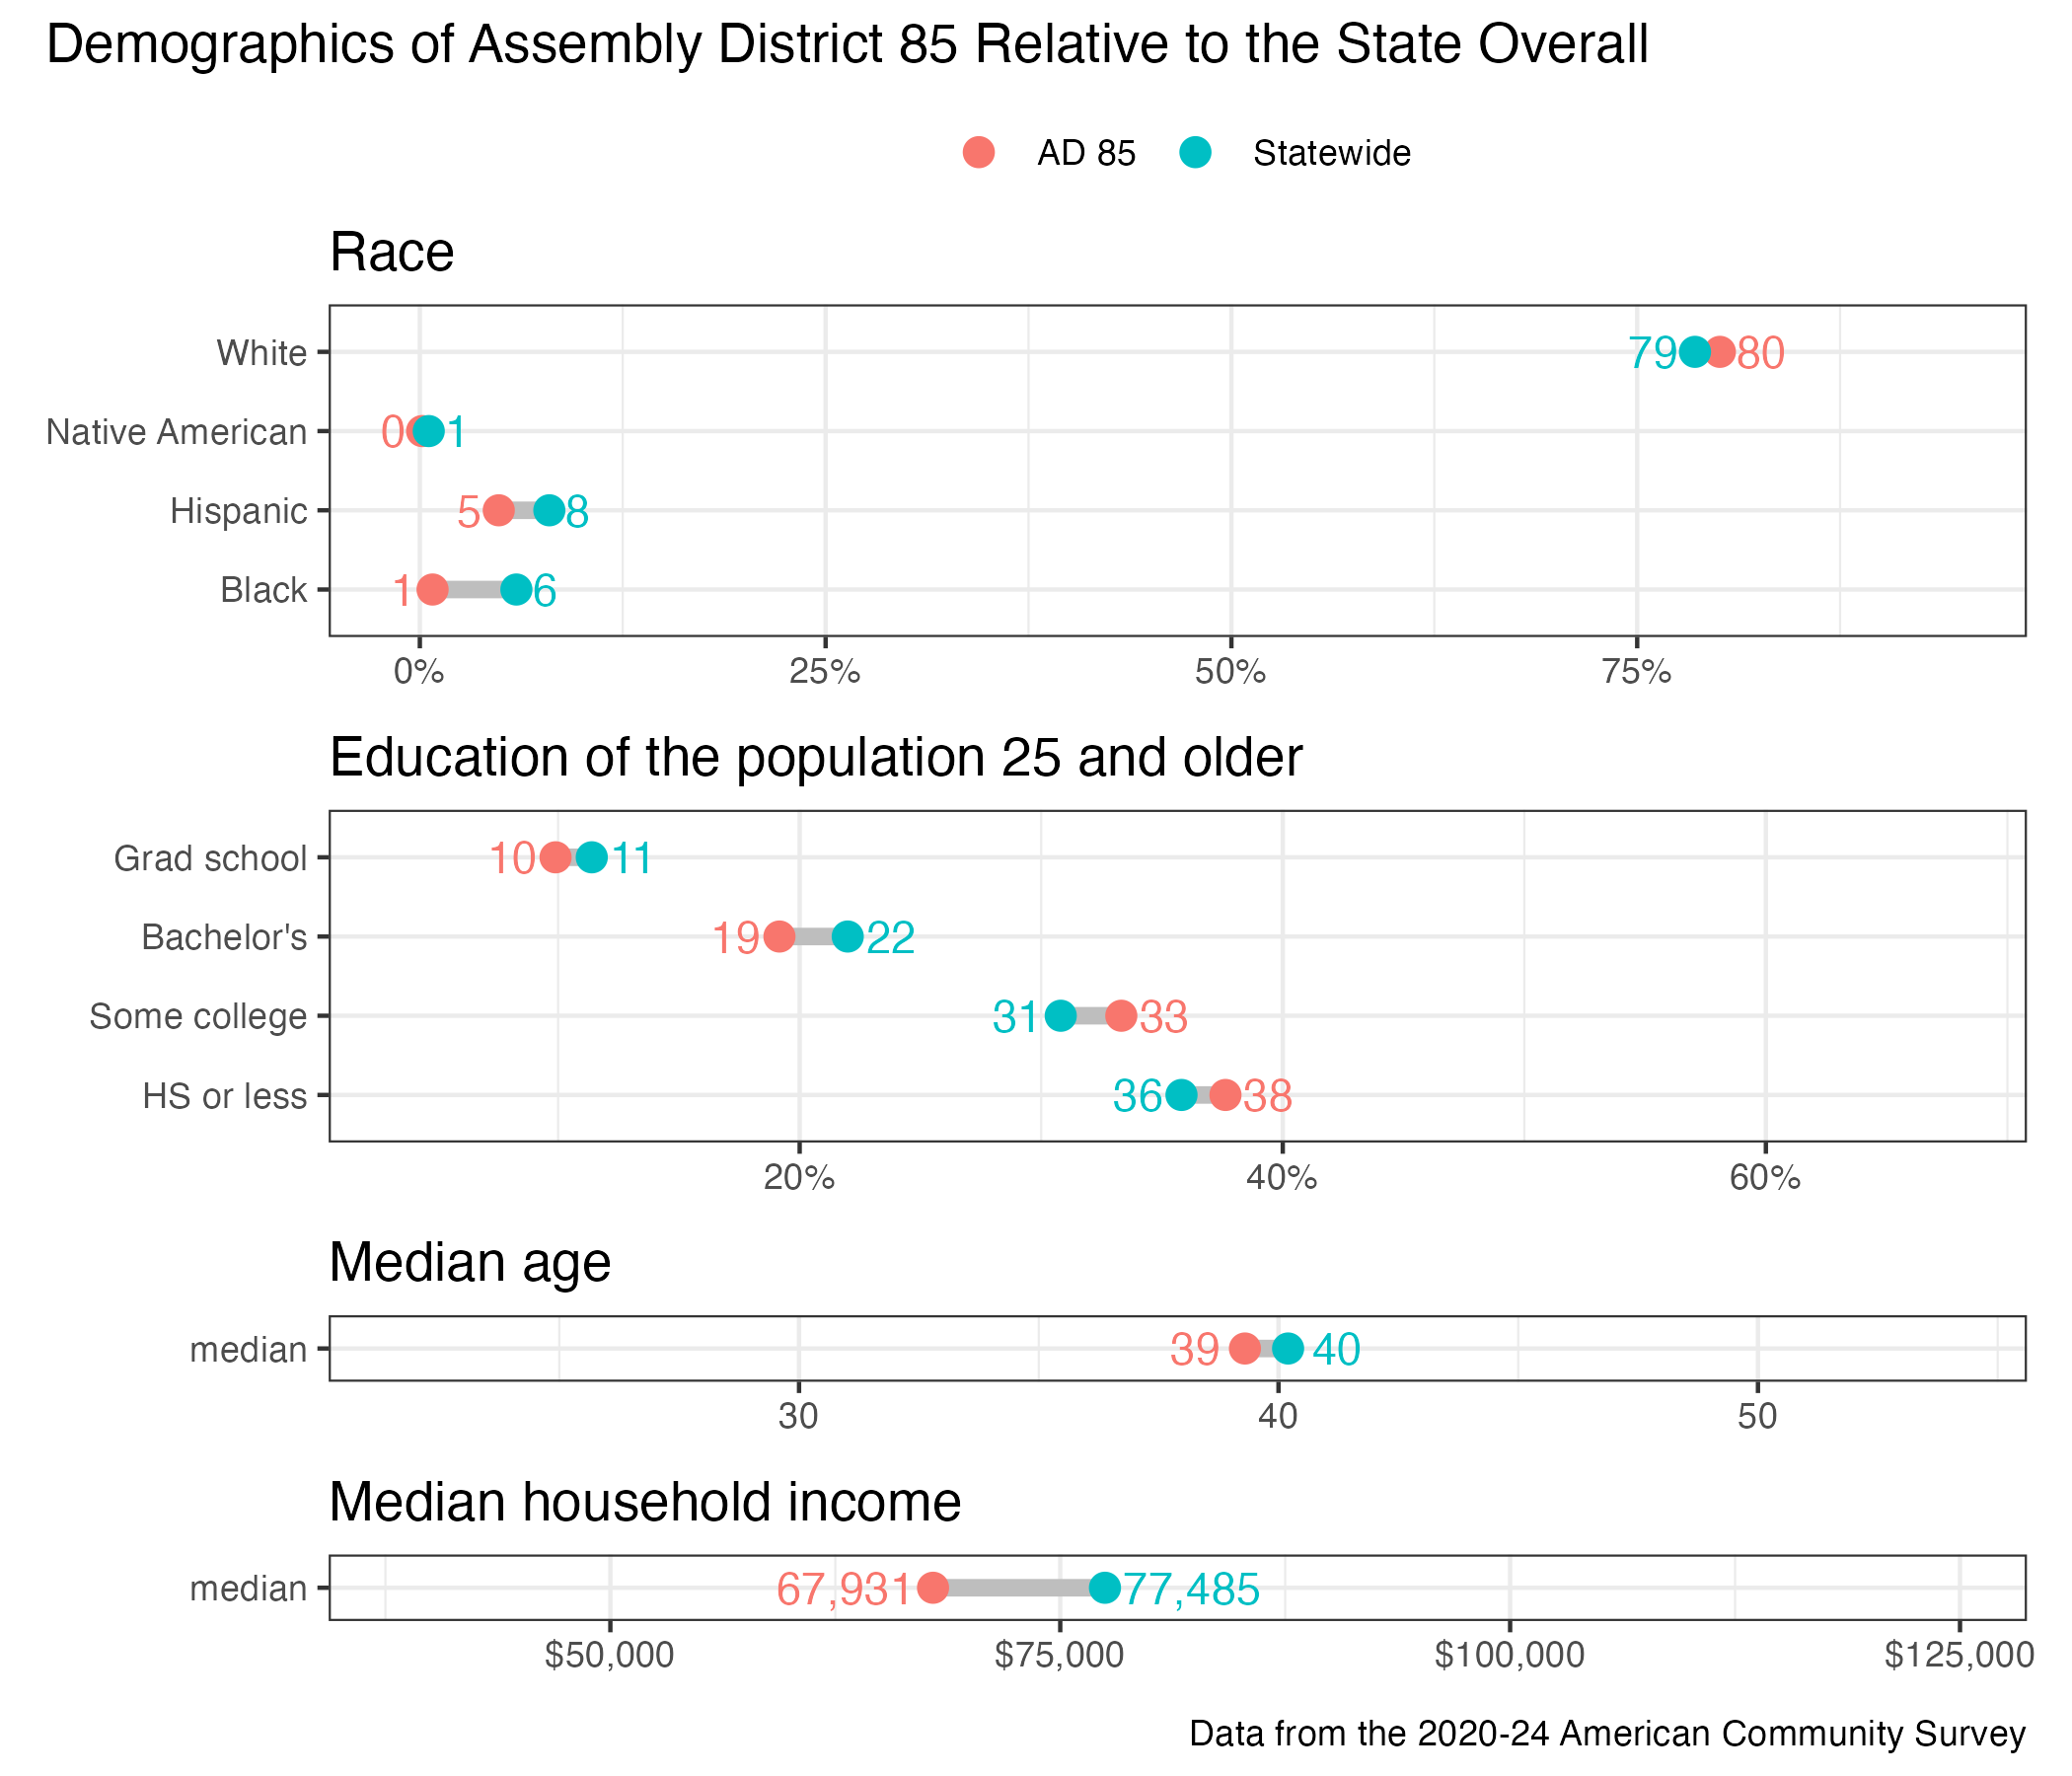
District demographics