27th Senate District
District
Candidates
| Senate District 27 Candidates on the Primary Ballot | ||
| Incumbent: Dianne H. Hesselbein | ||
Jan 1 thru July 30
|
||
|---|---|---|
| receipts | disbursements | |
| Democratic | ||
| Dianne Hesselbein | $46,559.65 | $97,004.03 |
| Data from the 2026 July Continuing Report. Any amended reports might not yet be shown. | ||
Past election results
| Election Results in Wisconsin State Senate District 27 | ||||||
votes
|
Dem. %1 |
margin (Dem. - Rep.)
|
||||
|---|---|---|---|---|---|---|
| total | Dem. | Rep. | votes | points2 | ||
| 2016 President | 101,113 | 70,891 | 23,754 | 74.9% | +47,137 | +49.8 |
| 2016 Senator | 100,789 | 71,697 | 27,487 | 72.3% | +44,210 | +44.6 |
| 2018 Governor | 98,542 | 72,657 | 24,204 | 75.0% | +48,453 | +50.0 |
| 2018 Senator | 98,317 | 75,439 | 22,760 | 76.8% | +52,679 | +53.6 |
| 2020 President | 116,481 | 87,866 | 26,635 | 76.7% | +61,231 | +53.5 |
| 2022 Governor | 102,698 | 80,622 | 21,371 | 79.0% | +59,251 | +58.1 |
| 2022 Senator | 102,554 | 78,659 | 23,659 | 76.9% | +55,000 | +53.8 |
| 2024 President | 121,736 | 91,653 | 27,859 | 76.7% | +63,794 | +53.4 |
| 2024 Senator | 121,111 | 91,288 | 28,382 | 76.3% | +62,906 | +52.6 |
| 2024 NA | NA | NA | NA | NA | NA | NA |
| 2025 WI Sup. Ct.3 | 97,637 | 79,336 | 18,241 | 81.3% | +61,095 | +62.6 |
| 1 Share of the two-party vote. For Rep. share, subtract from 100. | ||||||
| 2 Dem % of the two-party vote minus Rep % of the two-party vote | ||||||
| 3 Formally nonpartisan candidates assigned party labels based on state endorsements | ||||||
| Election results allocated into 2024 district boundaries based on population overlap. Calculations by John Johnson (johndjohnson.info). | ||||||
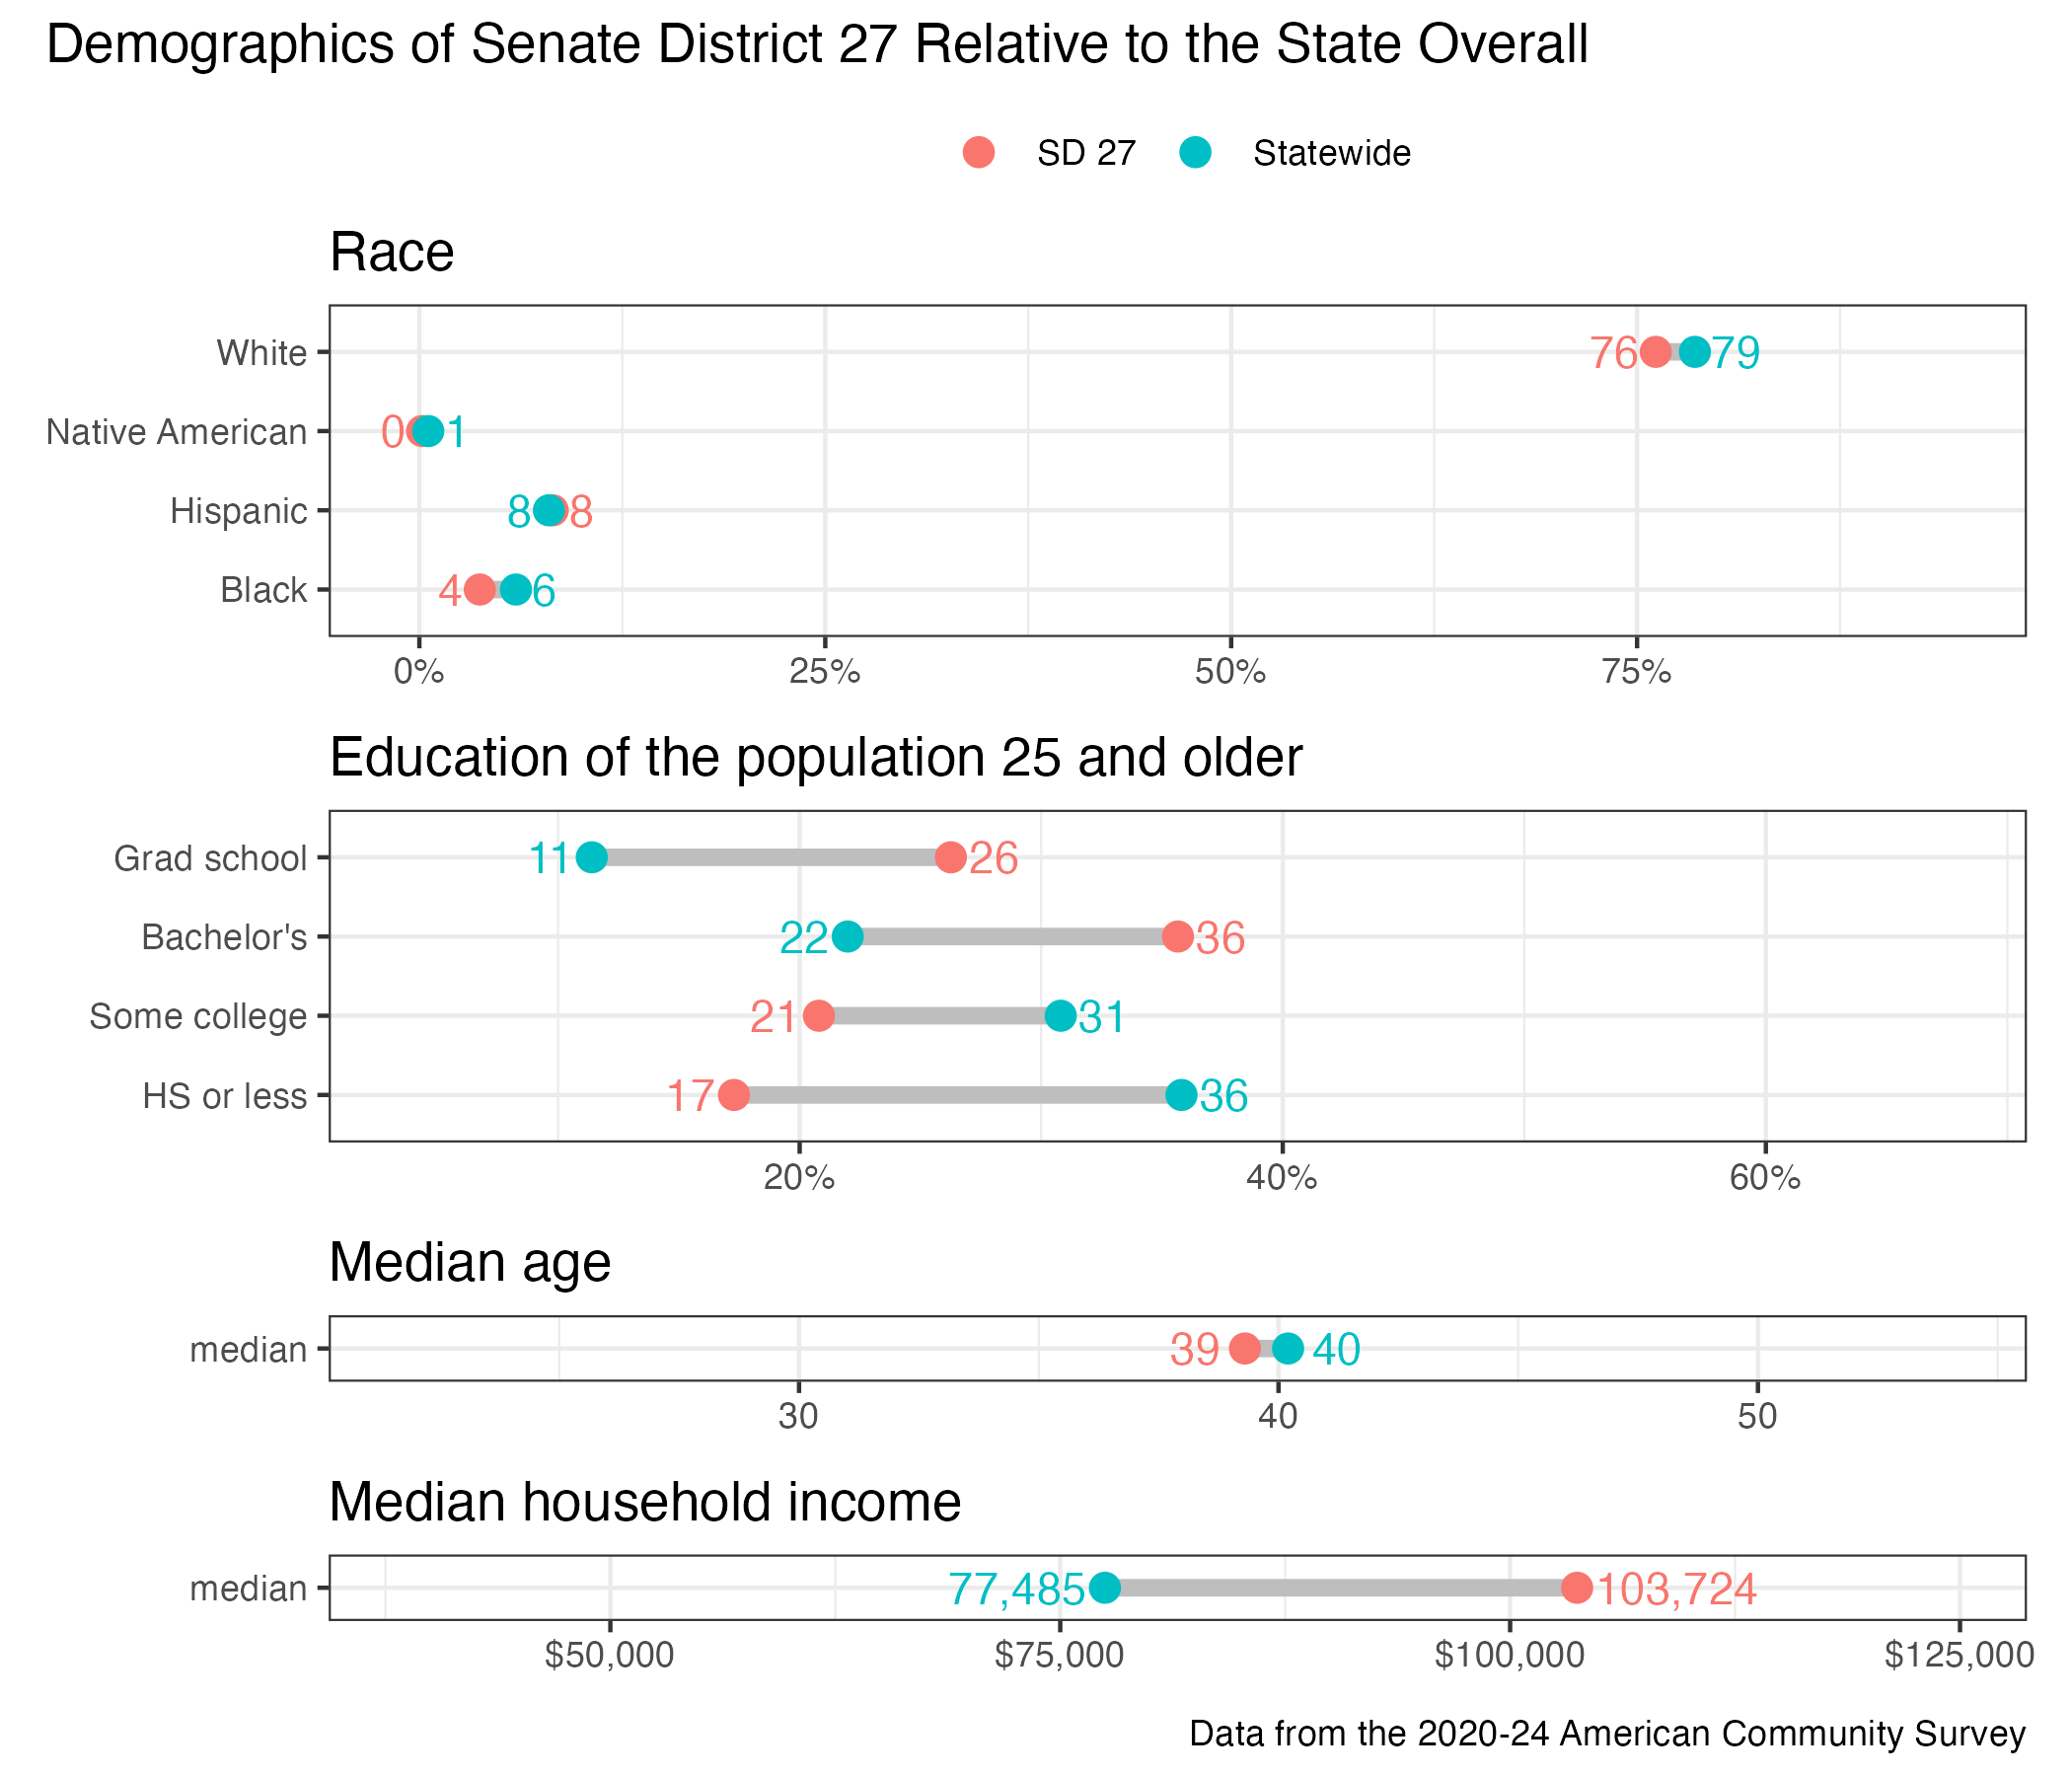
District demographics