87th Assembly District
District
Candidates
| Assembly District 87 Candidates on the Primary Ballot | ||
| Incumbent: Brent Jacobson | ||
Jan 1 thru July 30
|
||
|---|---|---|
| receipts | disbursements | |
| Republican | ||
| Brent Jacobson | $23,322.00 | $26,949.82 |
| Democratic | ||
| Bob Look | $0.00 | $0.00 |
| Data from the 2026 July Continuing Report. Any amended reports might not yet be shown. | ||
Past election results
| Election Results in Wisconsin State Assembly District 87 | ||||||
votes
|
Dem. %1 |
margin (Dem. - Rep.)
|
||||
|---|---|---|---|---|---|---|
| total | Dem. | Rep. | votes | points2 | ||
| 2016 President | 31,990 | 11,607 | 18,722 | 38.3% | −7,115 | −23.5 |
| 2016 Senator | 31,729 | 12,174 | 18,444 | 39.8% | −6,270 | −20.5 |
| 2018 Governor | 28,807 | 10,654 | 17,603 | 37.7% | −6,949 | −24.6 |
| 2018 Senator | 28,683 | 12,823 | 15,830 | 44.8% | −3,007 | −10.5 |
| 2020 President | 35,973 | 13,238 | 22,166 | 37.4% | −8,928 | −25.2 |
| 2022 Governor | 29,194 | 10,992 | 17,873 | 38.1% | −6,881 | −23.8 |
| 2022 Senator | 29,111 | 10,466 | 18,610 | 36.0% | −8,144 | −28.0 |
| 2024 President | 37,169 | 13,498 | 23,211 | 36.8% | −9,713 | −26.5 |
| 2024 Senator | 36,964 | 13,704 | 22,415 | 37.9% | −8,711 | −24.1 |
| 2024 WI Assembly | 36,192 | 12,273 | 23,885 | 33.9% | −11,612 | −32.1 |
| 2025 WI Sup. Ct.3 | 25,518 | 10,494 | 15,005 | 41.2% | −4,511 | −17.7 |
| 1 Share of the two-party vote. For Rep. share, subtract from 100. | ||||||
| 2 Dem % of the two-party vote minus Rep % of the two-party vote | ||||||
| 3 Formally nonpartisan candidates assigned party labels based on state endorsements | ||||||
| Election results allocated into 2024 district boundaries based on population overlap. Calculations by John Johnson (johndjohnson.info). | ||||||
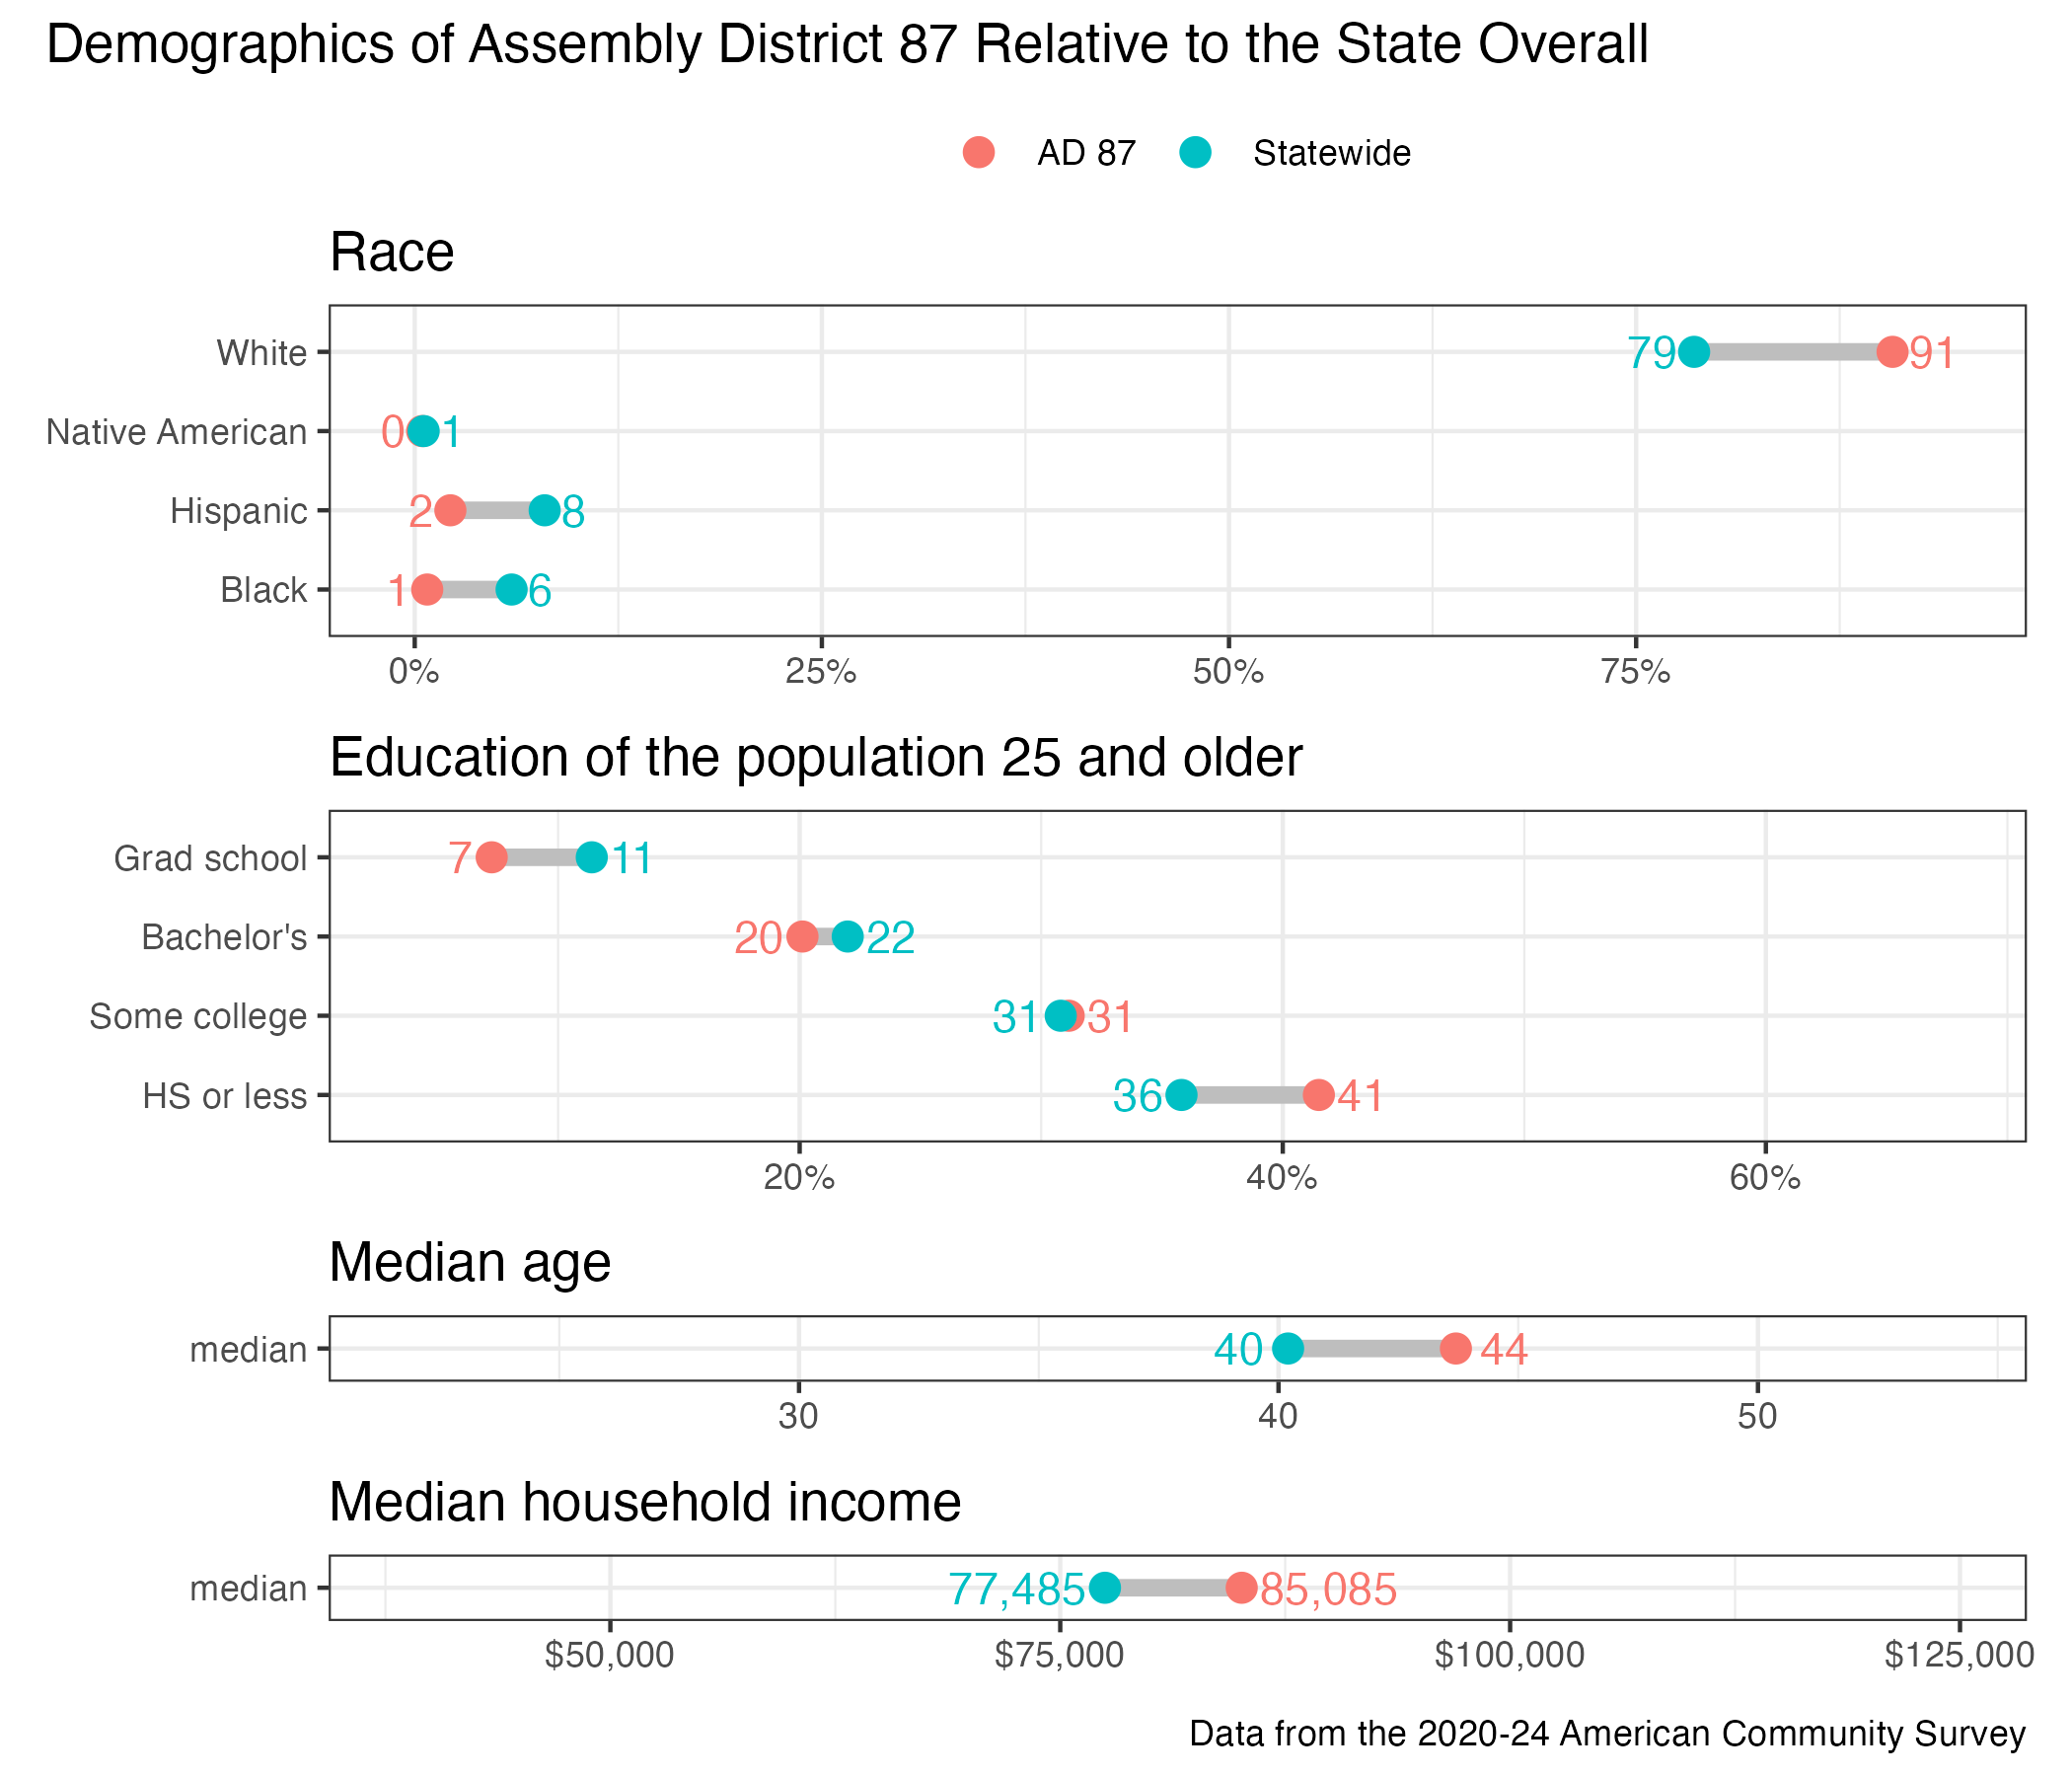
District demographics