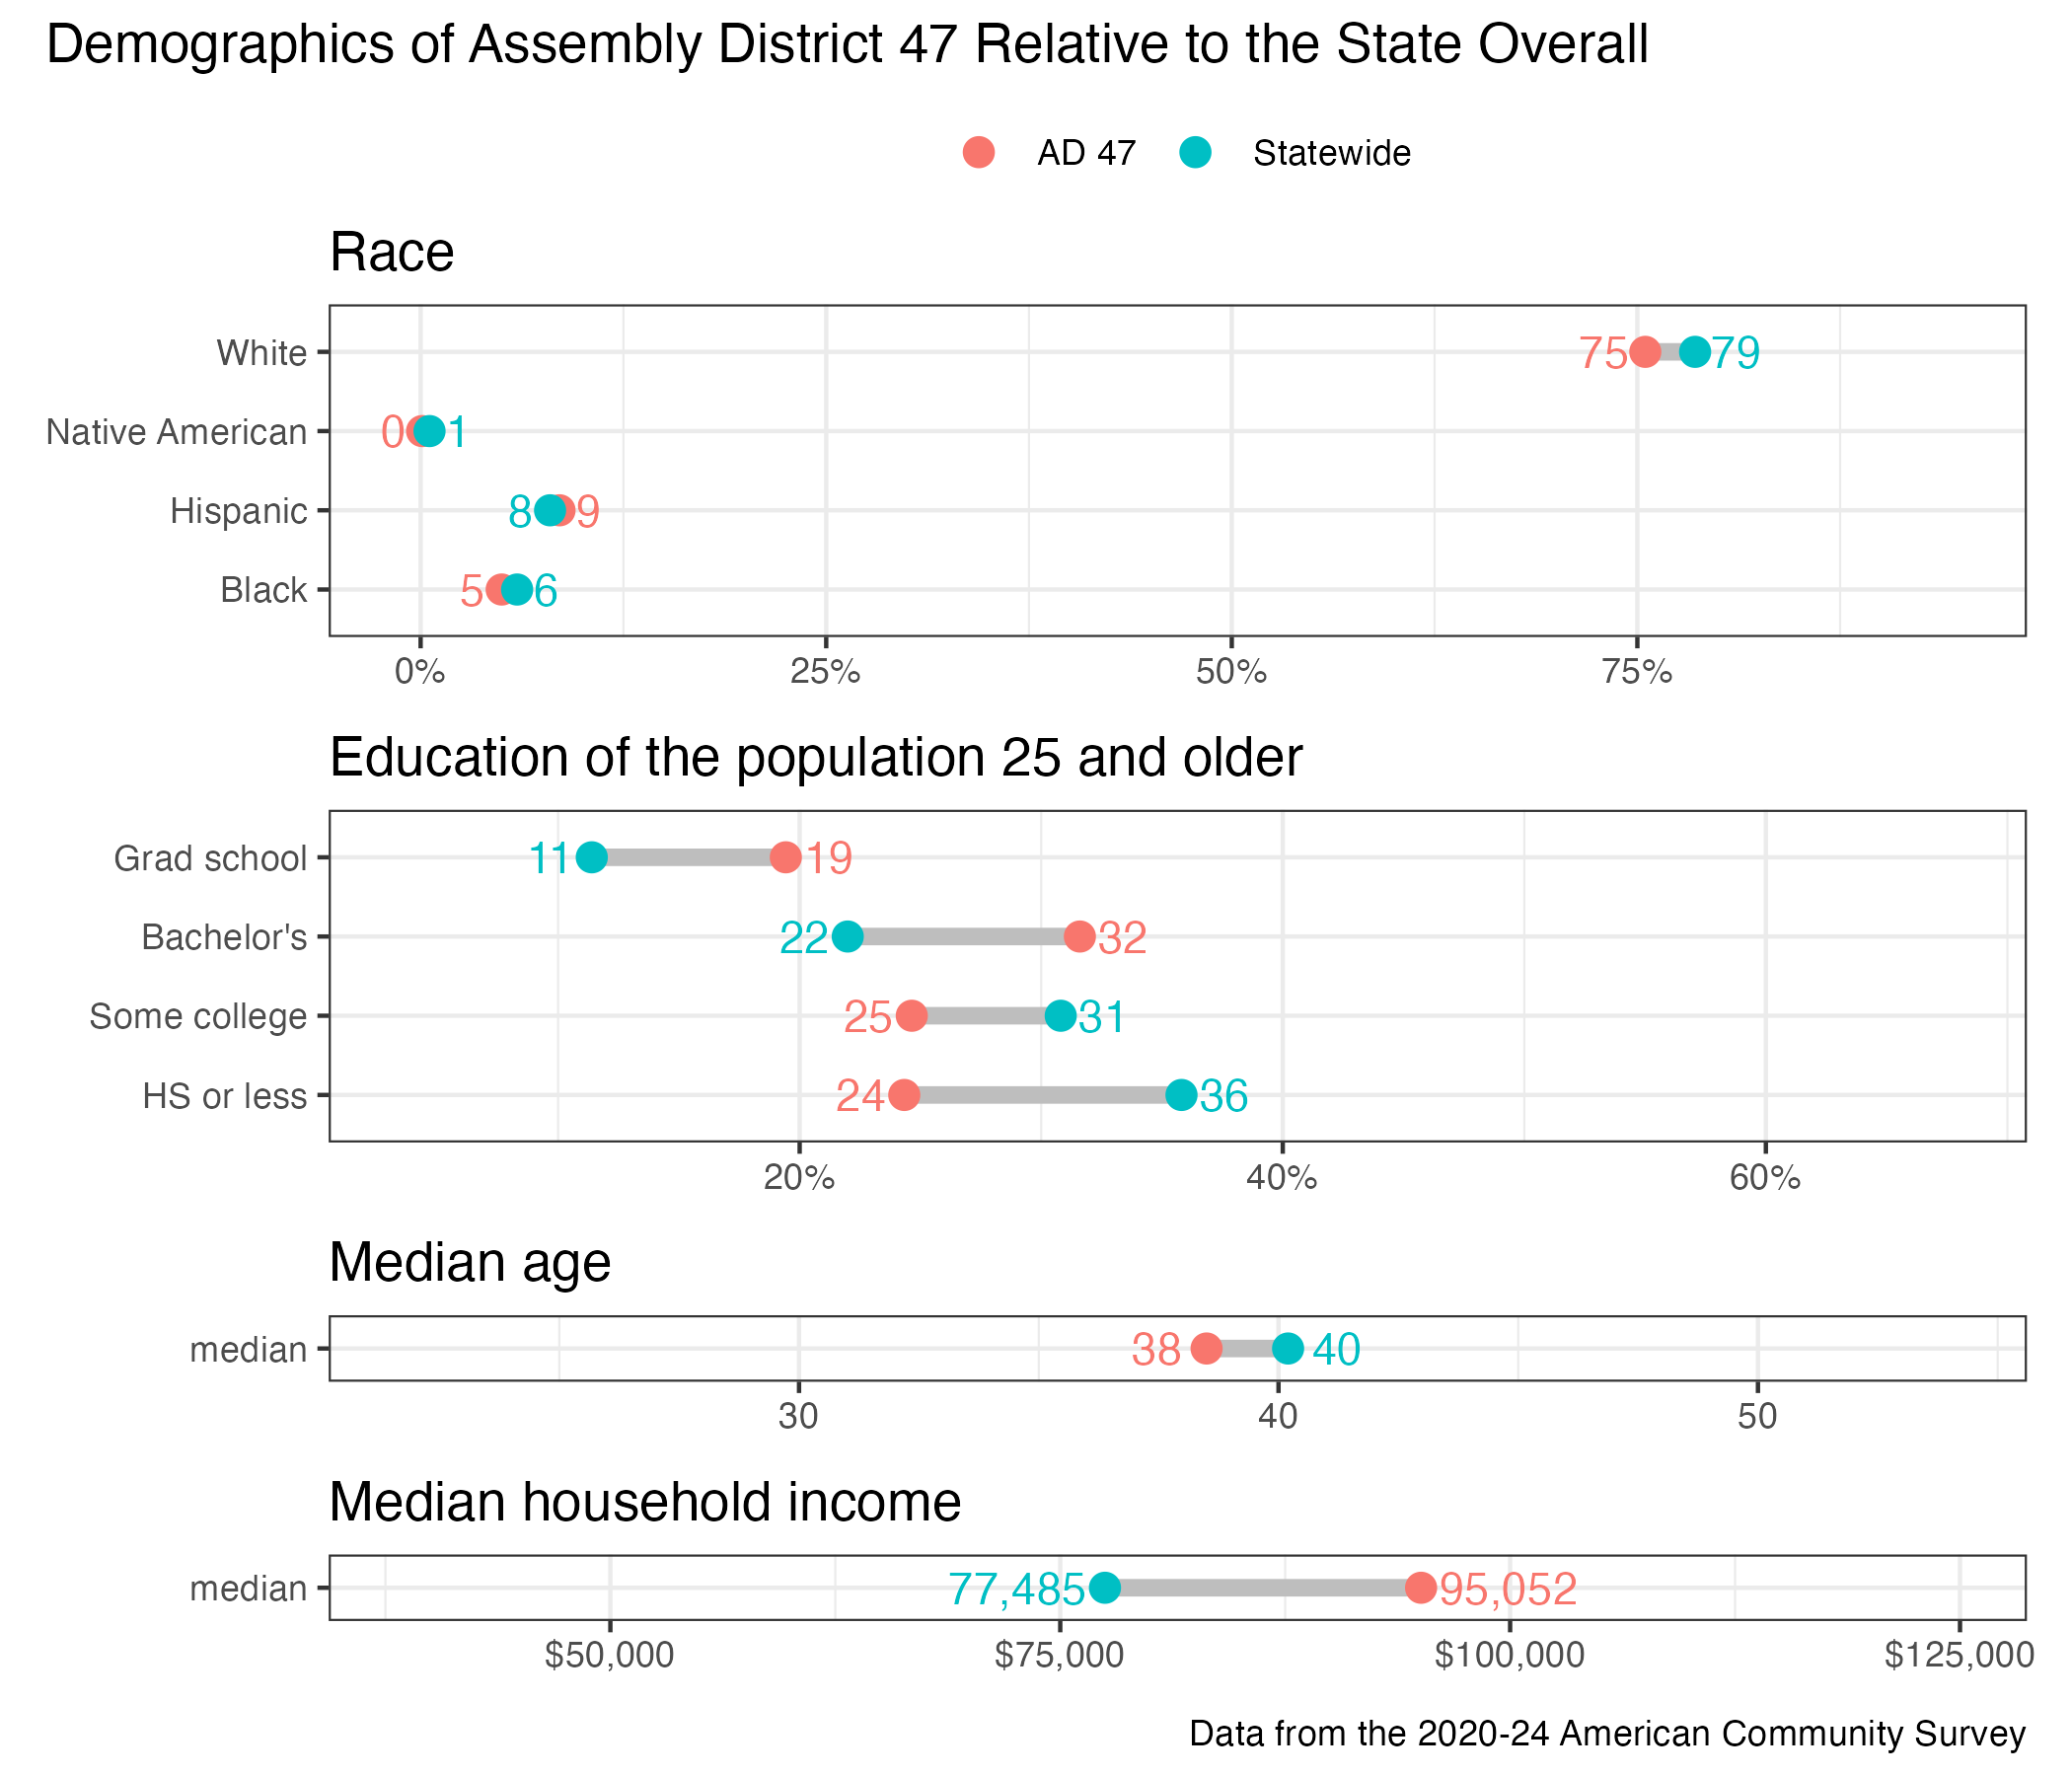
47th Assembly District
District
Candidates
| Assembly District 47 Candidates on the Primary Ballot | ||
| Incumbent: Randy Udell | ||
Jan 1 thru July 30
|
||
|---|---|---|
| receipts | disbursements | |
| Republican | ||
| Sandy Bakk | $0.00 | $0.00 |
| Democratic | ||
| Randy Udell | $22,643.00 | $1,047.09 |
| Data from the 2026 July Continuing Report. Any amended reports might not yet be shown. | ||
Past election results
| Election Results in Wisconsin State Assembly District 47 | ||||||
votes
|
Dem. %1 |
margin (Dem. - Rep.)
|
||||
|---|---|---|---|---|---|---|
| total | Dem. | Rep. | votes | points2 | ||
| 2016 President | 31,279 | 20,622 | 8,741 | 70.2% | +11,881 | +40.5 |
| 2016 Senator | 31,062 | 20,938 | 9,499 | 68.8% | +11,439 | +37.6 |
| 2018 Governor | 29,972 | 21,144 | 8,337 | 71.7% | +12,807 | +43.4 |
| 2018 Senator | 29,919 | 21,990 | 7,886 | 73.6% | +14,104 | +47.2 |
| 2020 President | 36,216 | 25,761 | 9,849 | 72.3% | +15,912 | +44.7 |
| 2022 Governor | 31,207 | 23,186 | 7,761 | 74.9% | +15,425 | +49.8 |
| 2022 Senator | 31,140 | 22,577 | 8,488 | 72.7% | +14,089 | +45.4 |
| 2024 President | 38,520 | 27,287 | 10,625 | 72.0% | +16,662 | +43.9 |
| 2024 Senator | 38,286 | 27,203 | 10,538 | 72.1% | +16,665 | +44.2 |
| 2024 WI Assembly | 29,579 | 29,040 | 0 | 100.0% | +29,040 | +100.0 |
| 2025 WI Sup. Ct.3 | 29,938 | 23,155 | 6,765 | 77.4% | +16,390 | +54.8 |
| 1 Share of the two-party vote. For Rep. share, subtract from 100. | ||||||
| 2 Dem % of the two-party vote minus Rep % of the two-party vote | ||||||
| 3 Formally nonpartisan candidates assigned party labels based on state endorsements | ||||||
| Election results allocated into 2024 district boundaries based on population overlap. Calculations by John Johnson (johndjohnson.info). | ||||||
District demographics