5th Assembly District
District
Candidates
| Assembly District 5 Candidates on the Primary Ballot | ||
| Incumbent: Joy Goeben | ||
Jan 1 thru July 30
|
||
|---|---|---|
| receipts | disbursements | |
| Republican | ||
| Joy Goeben | $18,770.00 | $1,662.43 |
| Democratic | ||
| Justin Schumacher | $0.00 | $0.00 |
| Wisconsin Green | ||
| David Schupbach | $1,493.06 | $489.00 |
| Data from the 2026 July Continuing Report. Any amended reports might not yet be shown. | ||
Past election results
| Election Results in Wisconsin State Assembly District 5 | ||||||
votes
|
Dem. %1 |
margin (Dem. - Rep.)
|
||||
|---|---|---|---|---|---|---|
| total | Dem. | Rep. | votes | points2 | ||
| 2016 President | 27,926 | 10,068 | 16,121 | 38.4% | −6,053 | −23.1 |
| 2016 Senator | 27,725 | 9,885 | 16,884 | 36.9% | −6,999 | −26.1 |
| 2018 Governor | 24,934 | 9,631 | 14,829 | 39.4% | −5,198 | −21.3 |
| 2018 Senator | 24,833 | 11,328 | 13,497 | 45.6% | −2,169 | −8.7 |
| 2020 President | 34,105 | 13,299 | 20,222 | 39.7% | −6,923 | −20.7 |
| 2022 Governor | 26,802 | 10,803 | 15,723 | 40.7% | −4,920 | −18.5 |
| 2022 Senator | 26,706 | 10,257 | 16,440 | 38.4% | −6,183 | −23.2 |
| 2024 President | 36,365 | 14,079 | 21,775 | 39.3% | −7,696 | −21.5 |
| 2024 Senator | 36,052 | 14,093 | 21,065 | 40.1% | −6,972 | −19.8 |
| 2024 WI Assembly | 35,110 | 13,063 | 22,041 | 37.2% | −8,978 | −25.6 |
| 2025 WI Sup. Ct.3 | 23,018 | 10,332 | 12,682 | 44.9% | −2,350 | −10.2 |
| 1 Share of the two-party vote. For Rep. share, subtract from 100. | ||||||
| 2 Dem % of the two-party vote minus Rep % of the two-party vote | ||||||
| 3 Formally nonpartisan candidates assigned party labels based on state endorsements | ||||||
| Election results allocated into 2024 district boundaries based on population overlap. Calculations by John Johnson (johndjohnson.info). | ||||||
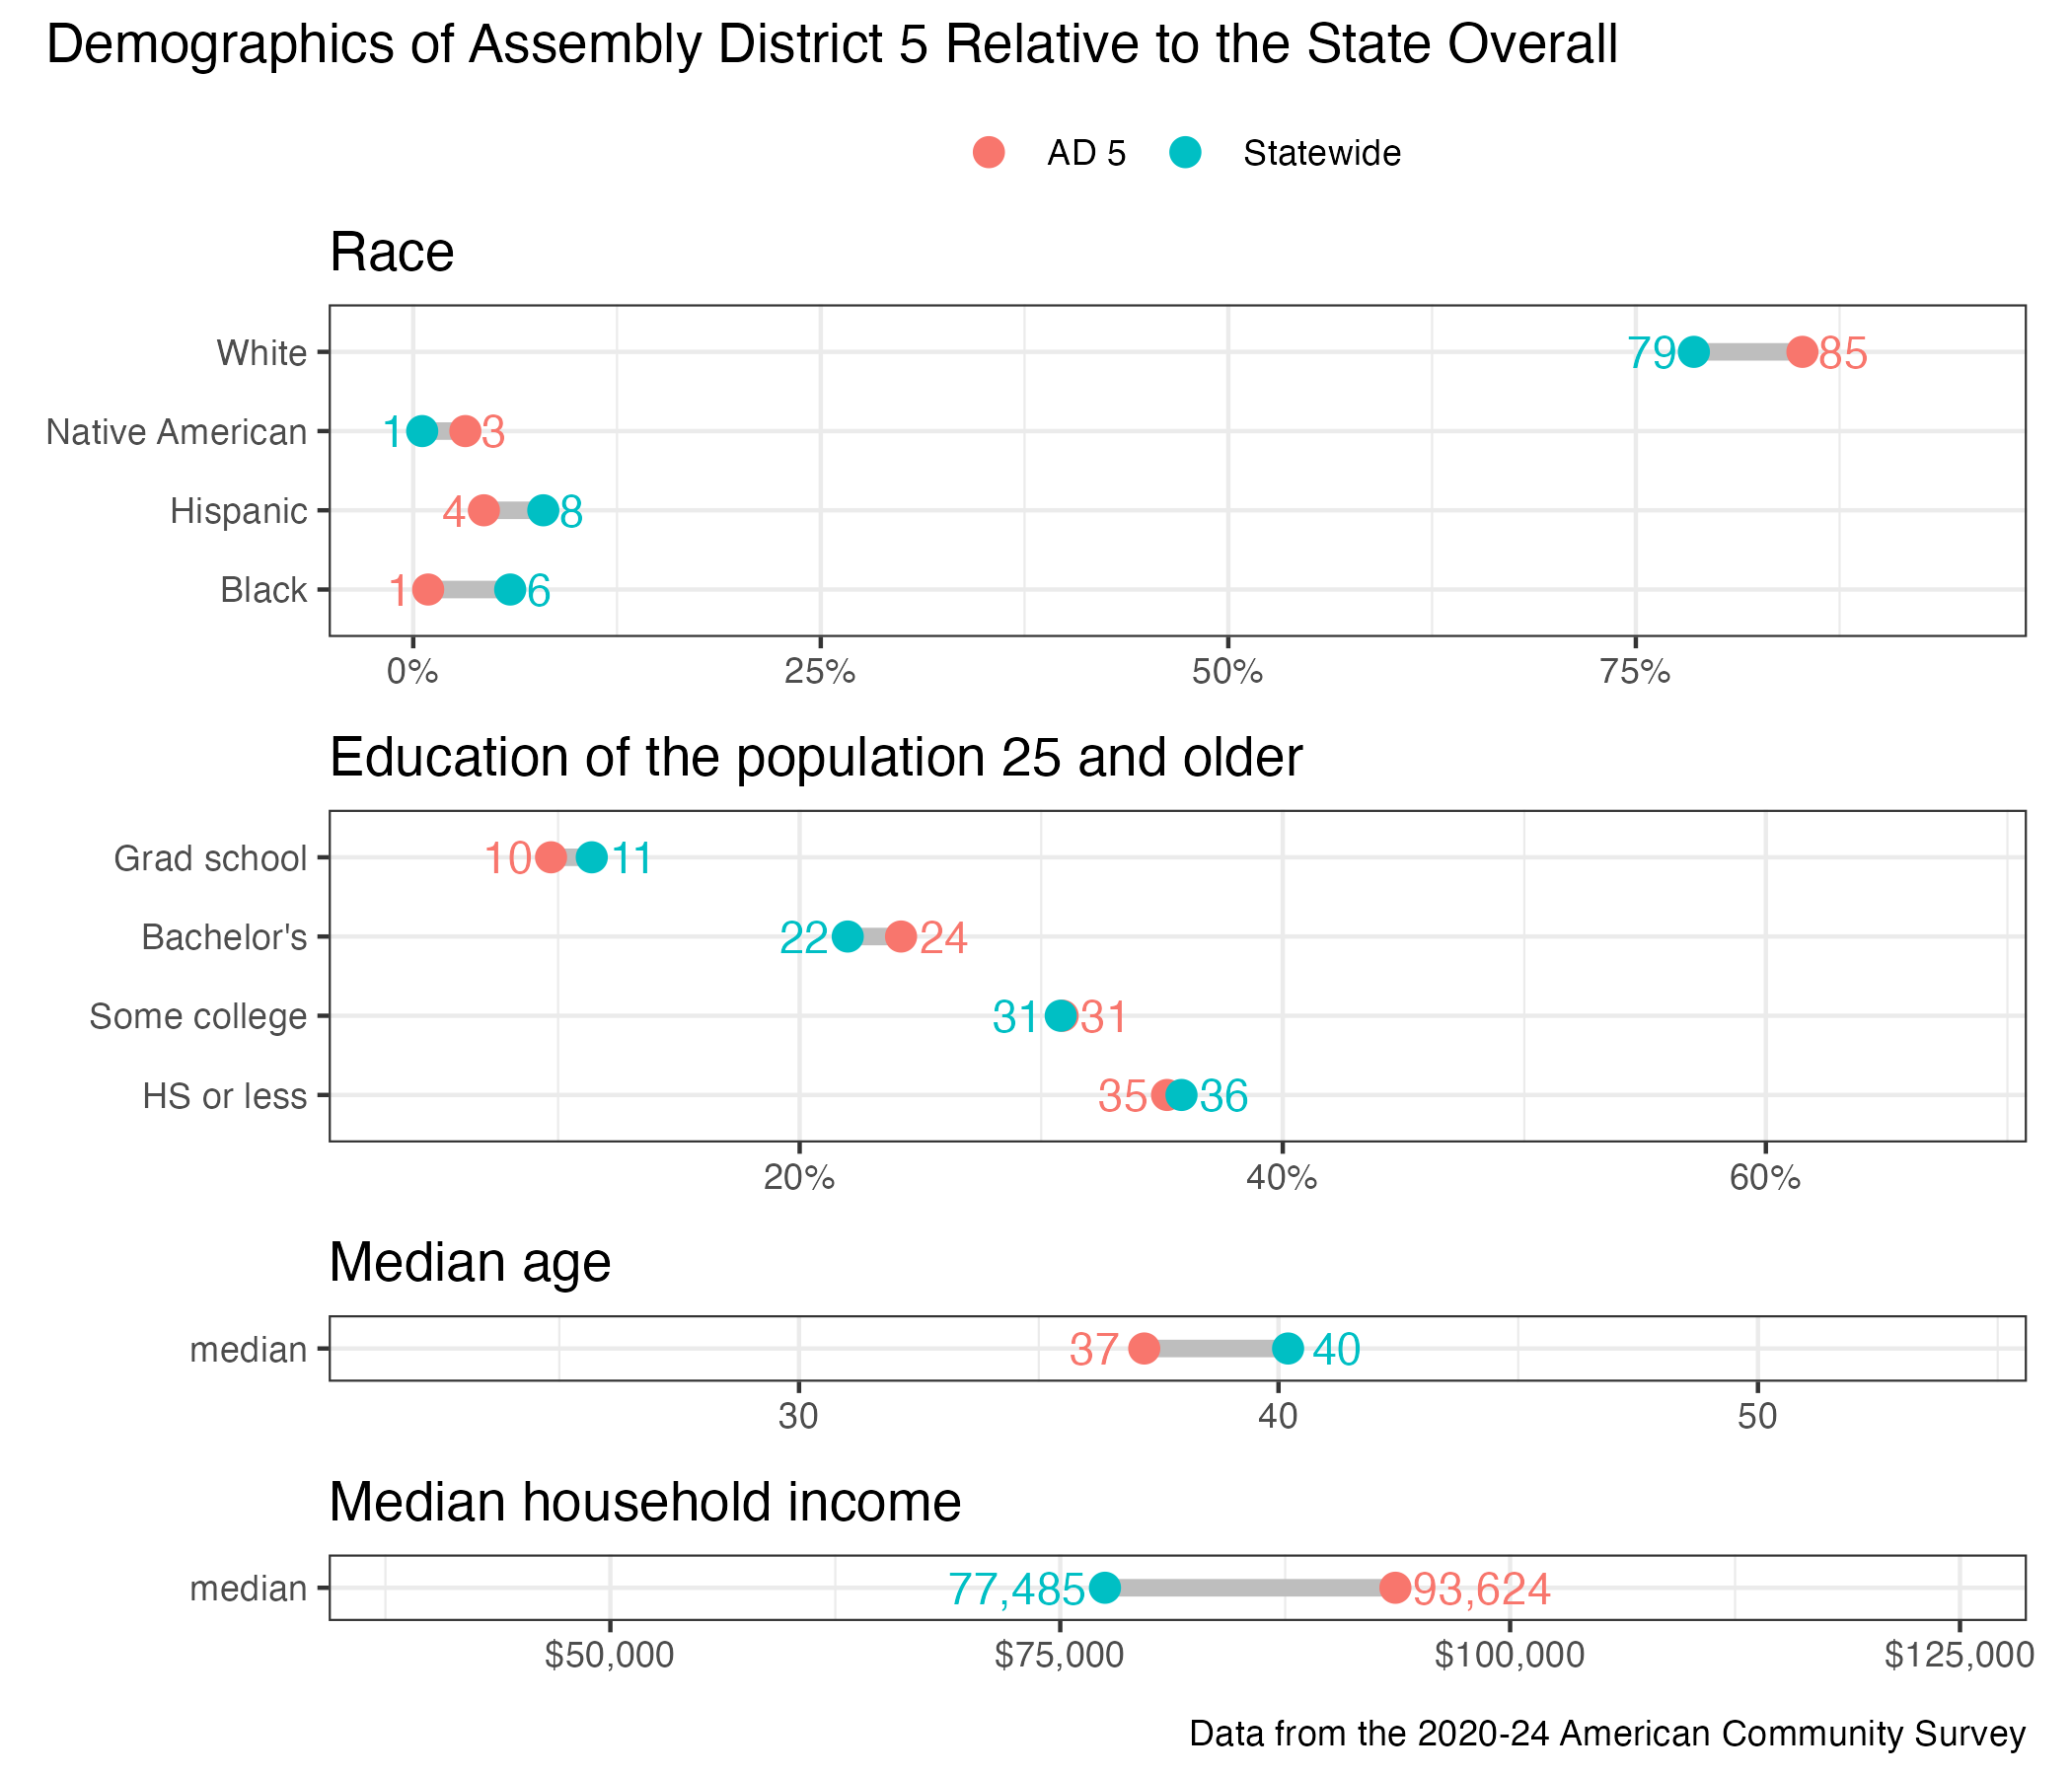
District demographics