10th Assembly District
District
Candidates
| Assembly District 10 Candidates on the Primary Ballot | ||
| Incumbent: Darrin Madison | ||
Jan 1 thru July 30
|
||
|---|---|---|
| receipts | disbursements | |
| Democratic | ||
| Darrin Madison | NA | NA |
| Wisconsin Green | ||
| Robert Longwell-Grice | $5,950.00 | $287.73 |
| Data from the 2026 July Continuing Report. Any amended reports might not yet be shown. | ||
Past election results
| Election Results in Wisconsin State Assembly District 10 | ||||||
votes
|
Dem. %1 |
margin (Dem. - Rep.)
|
||||
|---|---|---|---|---|---|---|
| total | Dem. | Rep. | votes | points2 | ||
| 2016 President | 31,651 | 26,000 | 4,239 | 86.0% | +21,761 | +72.0 |
| 2016 Senator | 31,169 | 24,997 | 5,668 | 81.5% | +19,329 | +63.0 |
| 2018 Governor | 28,461 | 23,330 | 4,761 | 83.1% | +18,569 | +66.1 |
| 2018 Senator | 28,493 | 24,245 | 4,213 | 85.2% | +20,032 | +70.4 |
| 2020 President | 31,922 | 27,005 | 4,456 | 85.8% | +22,549 | +71.7 |
| 2022 Governor | 24,357 | 20,914 | 3,261 | 86.5% | +17,653 | +73.0 |
| 2022 Senator | 24,496 | 20,964 | 3,488 | 85.7% | +17,476 | +71.5 |
| 2024 President | 31,061 | 25,957 | 4,449 | 85.4% | +21,508 | +70.7 |
| 2024 Senator | 30,705 | 25,784 | 4,367 | 85.5% | +21,417 | +71.0 |
| 2024 WI Assembly | 25,222 | 24,882 | 0 | 100.0% | +24,882 | +100.0 |
| 2025 WI Sup. Ct.3 | 21,637 | 18,932 | 2,684 | 87.6% | +16,248 | +75.2 |
| 1 Share of the two-party vote. For Rep. share, subtract from 100. | ||||||
| 2 Dem % of the two-party vote minus Rep % of the two-party vote | ||||||
| 3 Formally nonpartisan candidates assigned party labels based on state endorsements | ||||||
| Election results allocated into 2024 district boundaries based on population overlap. Calculations by John Johnson (johndjohnson.info). | ||||||
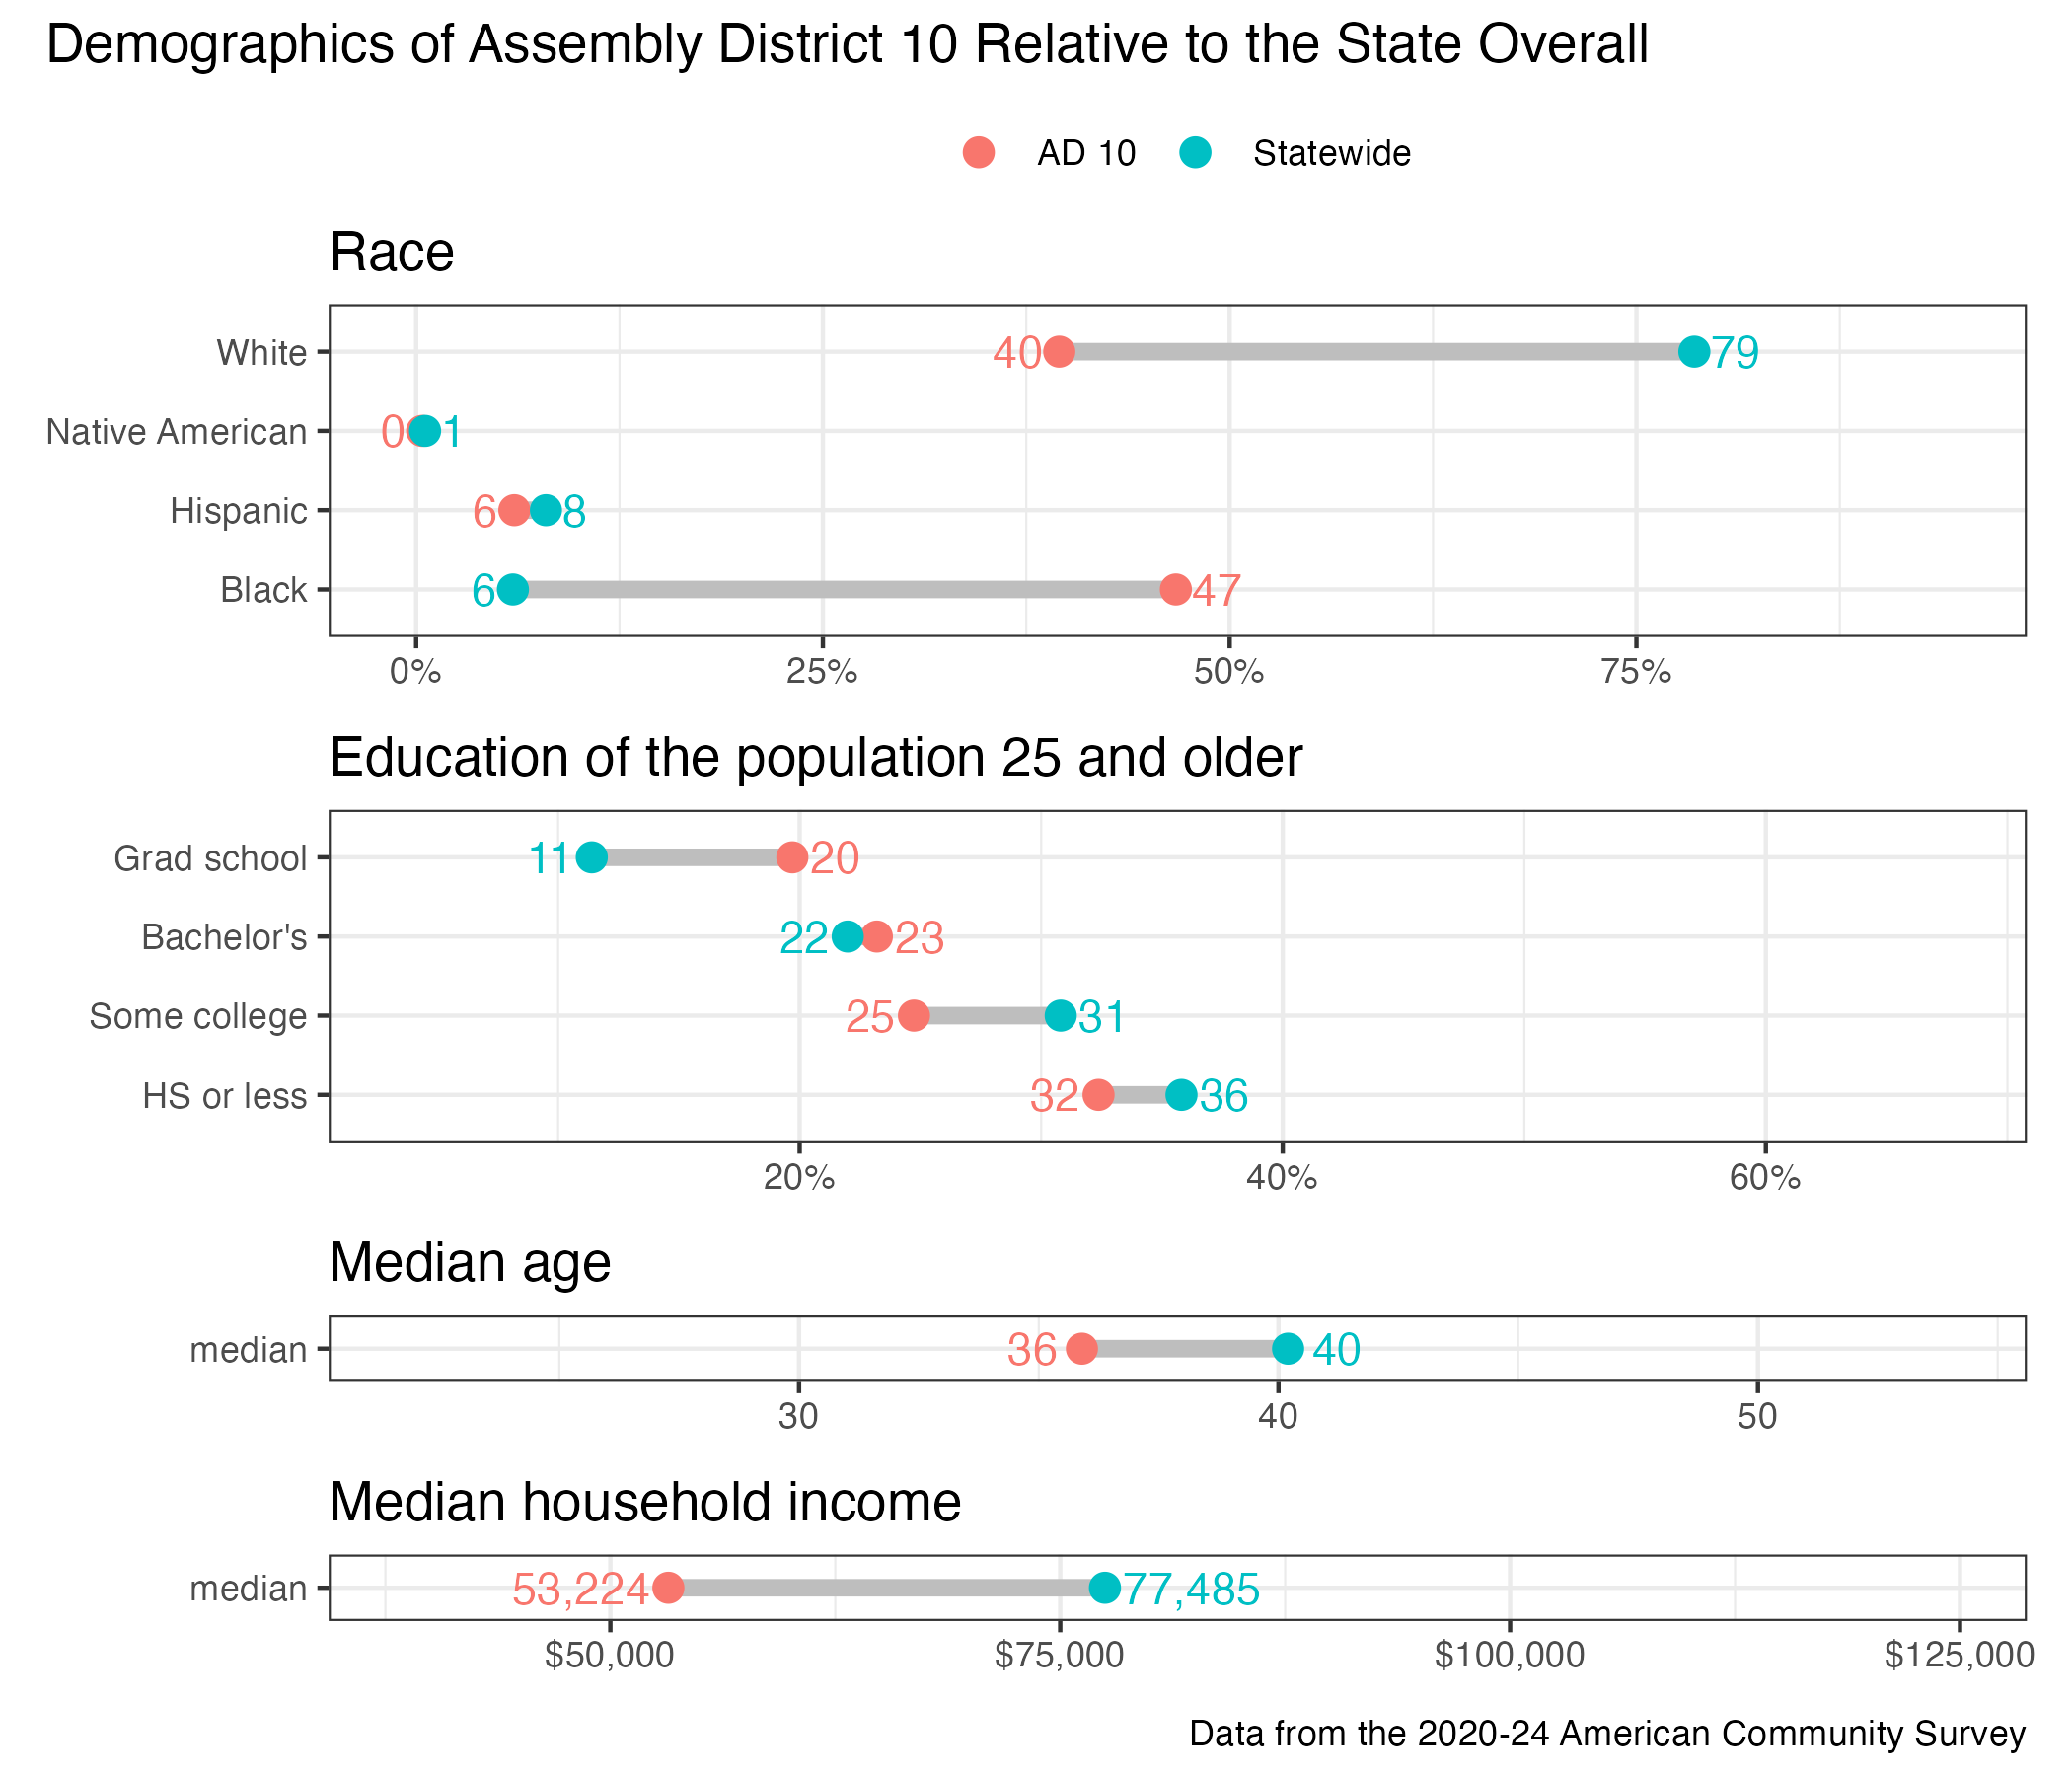
District demographics