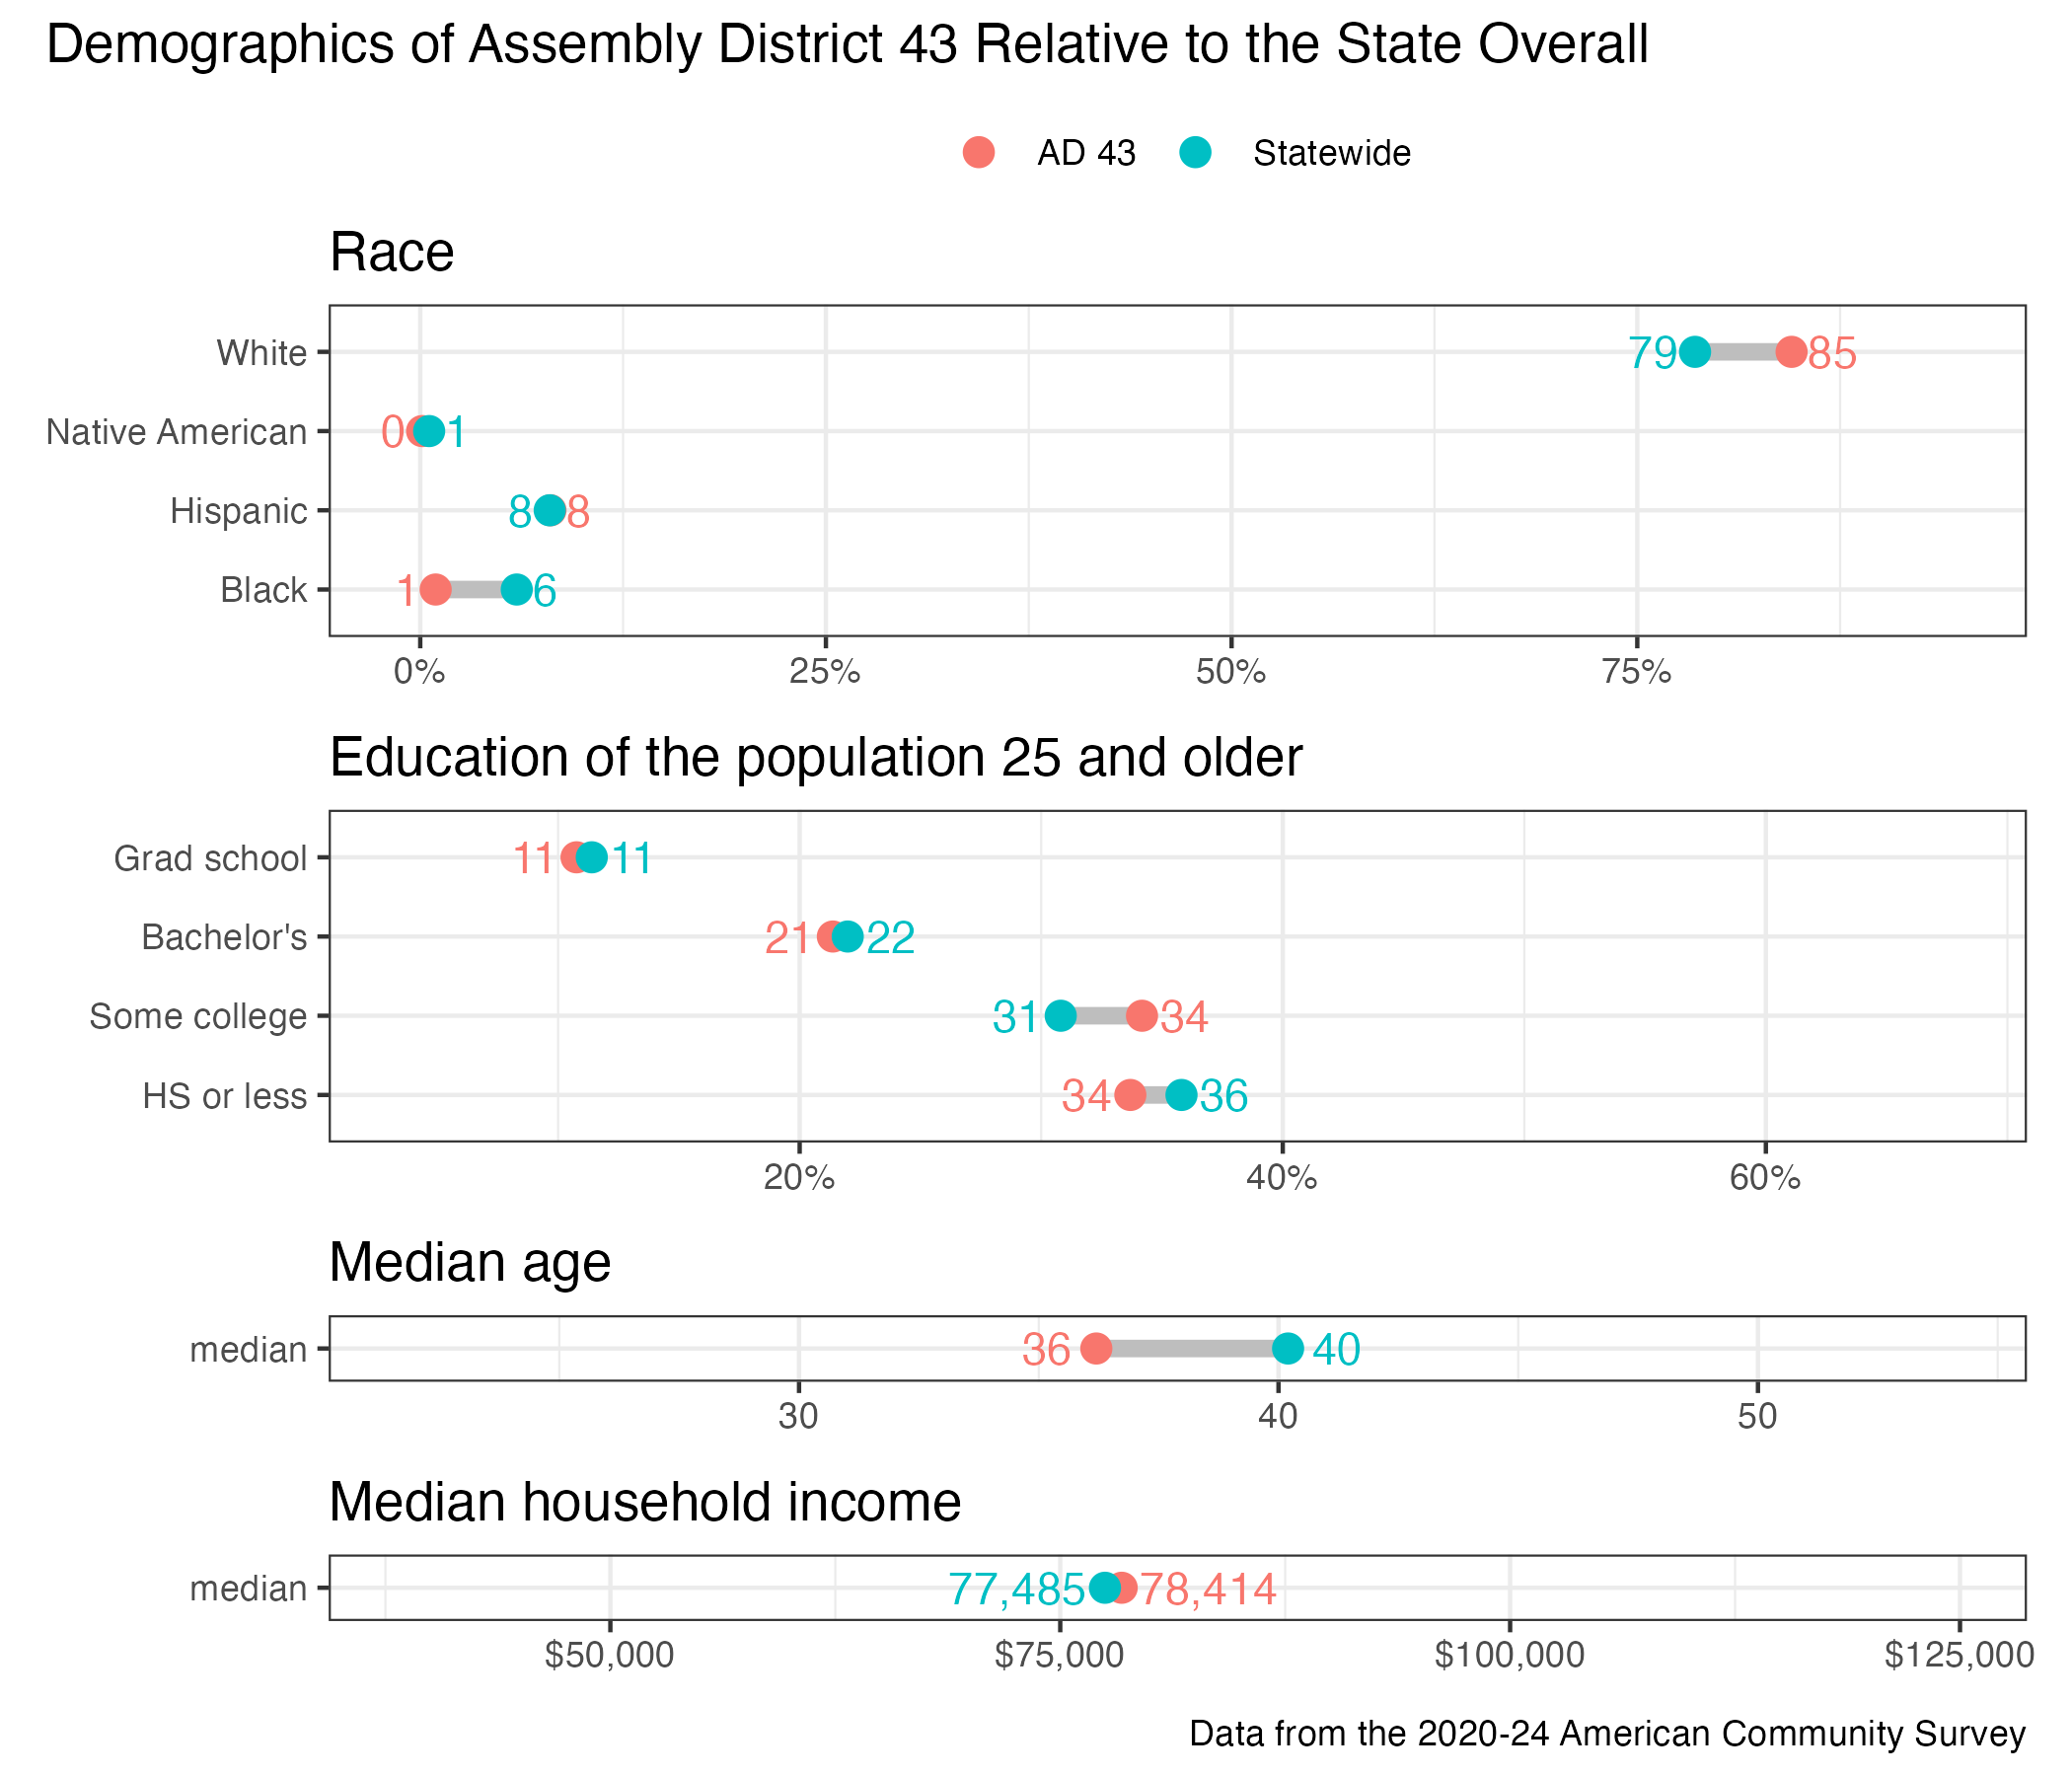
43rd Assembly District
District
Candidates
| Assembly District 43 Candidates on the Primary Ballot | ||
| Incumbent: Brienne Brown | ||
Jan 1 thru July 30
|
||
|---|---|---|
| receipts | disbursements | |
| Republican | ||
| Paul McGraw | $8,959.10 | $1,757.73 |
| Democratic | ||
| Brienne Brown | $27,730.00 | $8,507.83 |
| Data from the 2026 July Continuing Report. Any amended reports might not yet be shown. | ||
Past election results
| Election Results in Wisconsin State Assembly District 43 | ||||||
votes
|
Dem. %1 |
margin (Dem. - Rep.)
|
||||
|---|---|---|---|---|---|---|
| total | Dem. | Rep. | votes | points2 | ||
| 2016 President | 30,570 | 15,135 | 13,097 | 53.6% | +2,038 | +7.2 |
| 2016 Senator | 30,224 | 15,839 | 13,508 | 54.0% | +2,331 | +7.9 |
| 2018 Governor | 26,867 | 14,969 | 11,276 | 57.0% | +3,693 | +14.1 |
| 2018 Senator | 26,735 | 16,110 | 10,597 | 60.3% | +5,513 | +20.6 |
| 2020 President | 31,968 | 17,218 | 14,172 | 54.9% | +3,046 | +9.7 |
| 2022 Governor | 26,052 | 14,886 | 10,903 | 57.7% | +3,983 | +15.4 |
| 2022 Senator | 25,996 | 14,239 | 11,701 | 54.9% | +2,538 | +9.8 |
| 2024 President | 33,873 | 17,542 | 15,775 | 52.7% | +1,767 | +5.3 |
| 2024 Senator | 33,547 | 17,684 | 15,171 | 53.8% | +2,513 | +7.6 |
| 2024 WI Assembly | 32,664 | 16,736 | 15,889 | 51.3% | +847 | +2.6 |
| 2025 WI Sup. Ct.3 | 23,049 | 13,912 | 9,122 | 60.4% | +4,790 | +20.8 |
| 1 Share of the two-party vote. For Rep. share, subtract from 100. | ||||||
| 2 Dem % of the two-party vote minus Rep % of the two-party vote | ||||||
| 3 Formally nonpartisan candidates assigned party labels based on state endorsements | ||||||
| Election results allocated into 2024 district boundaries based on population overlap. Calculations by John Johnson (johndjohnson.info). | ||||||
District demographics