69th Assembly District
District
Candidates
| Assembly District 69 Candidates on the Primary Ballot | ||
| Incumbent: Karen Hurd | ||
Jan 1 thru July 30
|
||
|---|---|---|
| receipts | disbursements | |
| Independent | ||
| Josh Kelley | $0.00 | $0.00 |
| Republican | ||
| Karen Hurd | $21,424.00 | $24,961.80 |
| Democratic | ||
| Roger Halls | $104.00 | $0.16 |
| Data from the 2026 July Continuing Report. Any amended reports might not yet be shown. | ||
Past election results
| Election Results in Wisconsin State Assembly District 69 | ||||||
votes
|
Dem. %1 |
margin (Dem. - Rep.)
|
||||
|---|---|---|---|---|---|---|
| total | Dem. | Rep. | votes | points2 | ||
| 2016 President | 24,531 | 7,253 | 15,899 | 31.3% | −8,646 | −37.3 |
| 2016 Senator | 24,272 | 8,252 | 14,908 | 35.6% | −6,656 | −28.7 |
| 2018 Governor | 20,826 | 6,787 | 13,659 | 33.2% | −6,872 | −33.6 |
| 2018 Senator | 20,689 | 8,758 | 11,924 | 42.3% | −3,166 | −15.3 |
| 2020 President | 26,857 | 7,779 | 18,440 | 29.7% | −10,661 | −40.7 |
| 2022 Governor | 21,431 | 6,658 | 14,405 | 31.6% | −7,747 | −36.8 |
| 2022 Senator | 21,296 | 6,098 | 15,163 | 28.7% | −9,065 | −42.6 |
| 2024 President | 27,887 | 7,937 | 19,449 | 29.0% | −11,512 | −42.0 |
| 2024 Senator | 27,637 | 8,409 | 18,470 | 31.3% | −10,061 | −37.4 |
| 2024 WI Assembly | 27,173 | 6,565 | 19,534 | 25.2% | −12,969 | −49.7 |
| 2025 WI Sup. Ct.3 | 18,467 | 6,407 | 12,048 | 34.7% | −5,641 | −30.6 |
| 1 Share of the two-party vote. For Rep. share, subtract from 100. | ||||||
| 2 Dem % of the two-party vote minus Rep % of the two-party vote | ||||||
| 3 Formally nonpartisan candidates assigned party labels based on state endorsements | ||||||
| Election results allocated into 2024 district boundaries based on population overlap. Calculations by John Johnson (johndjohnson.info). | ||||||
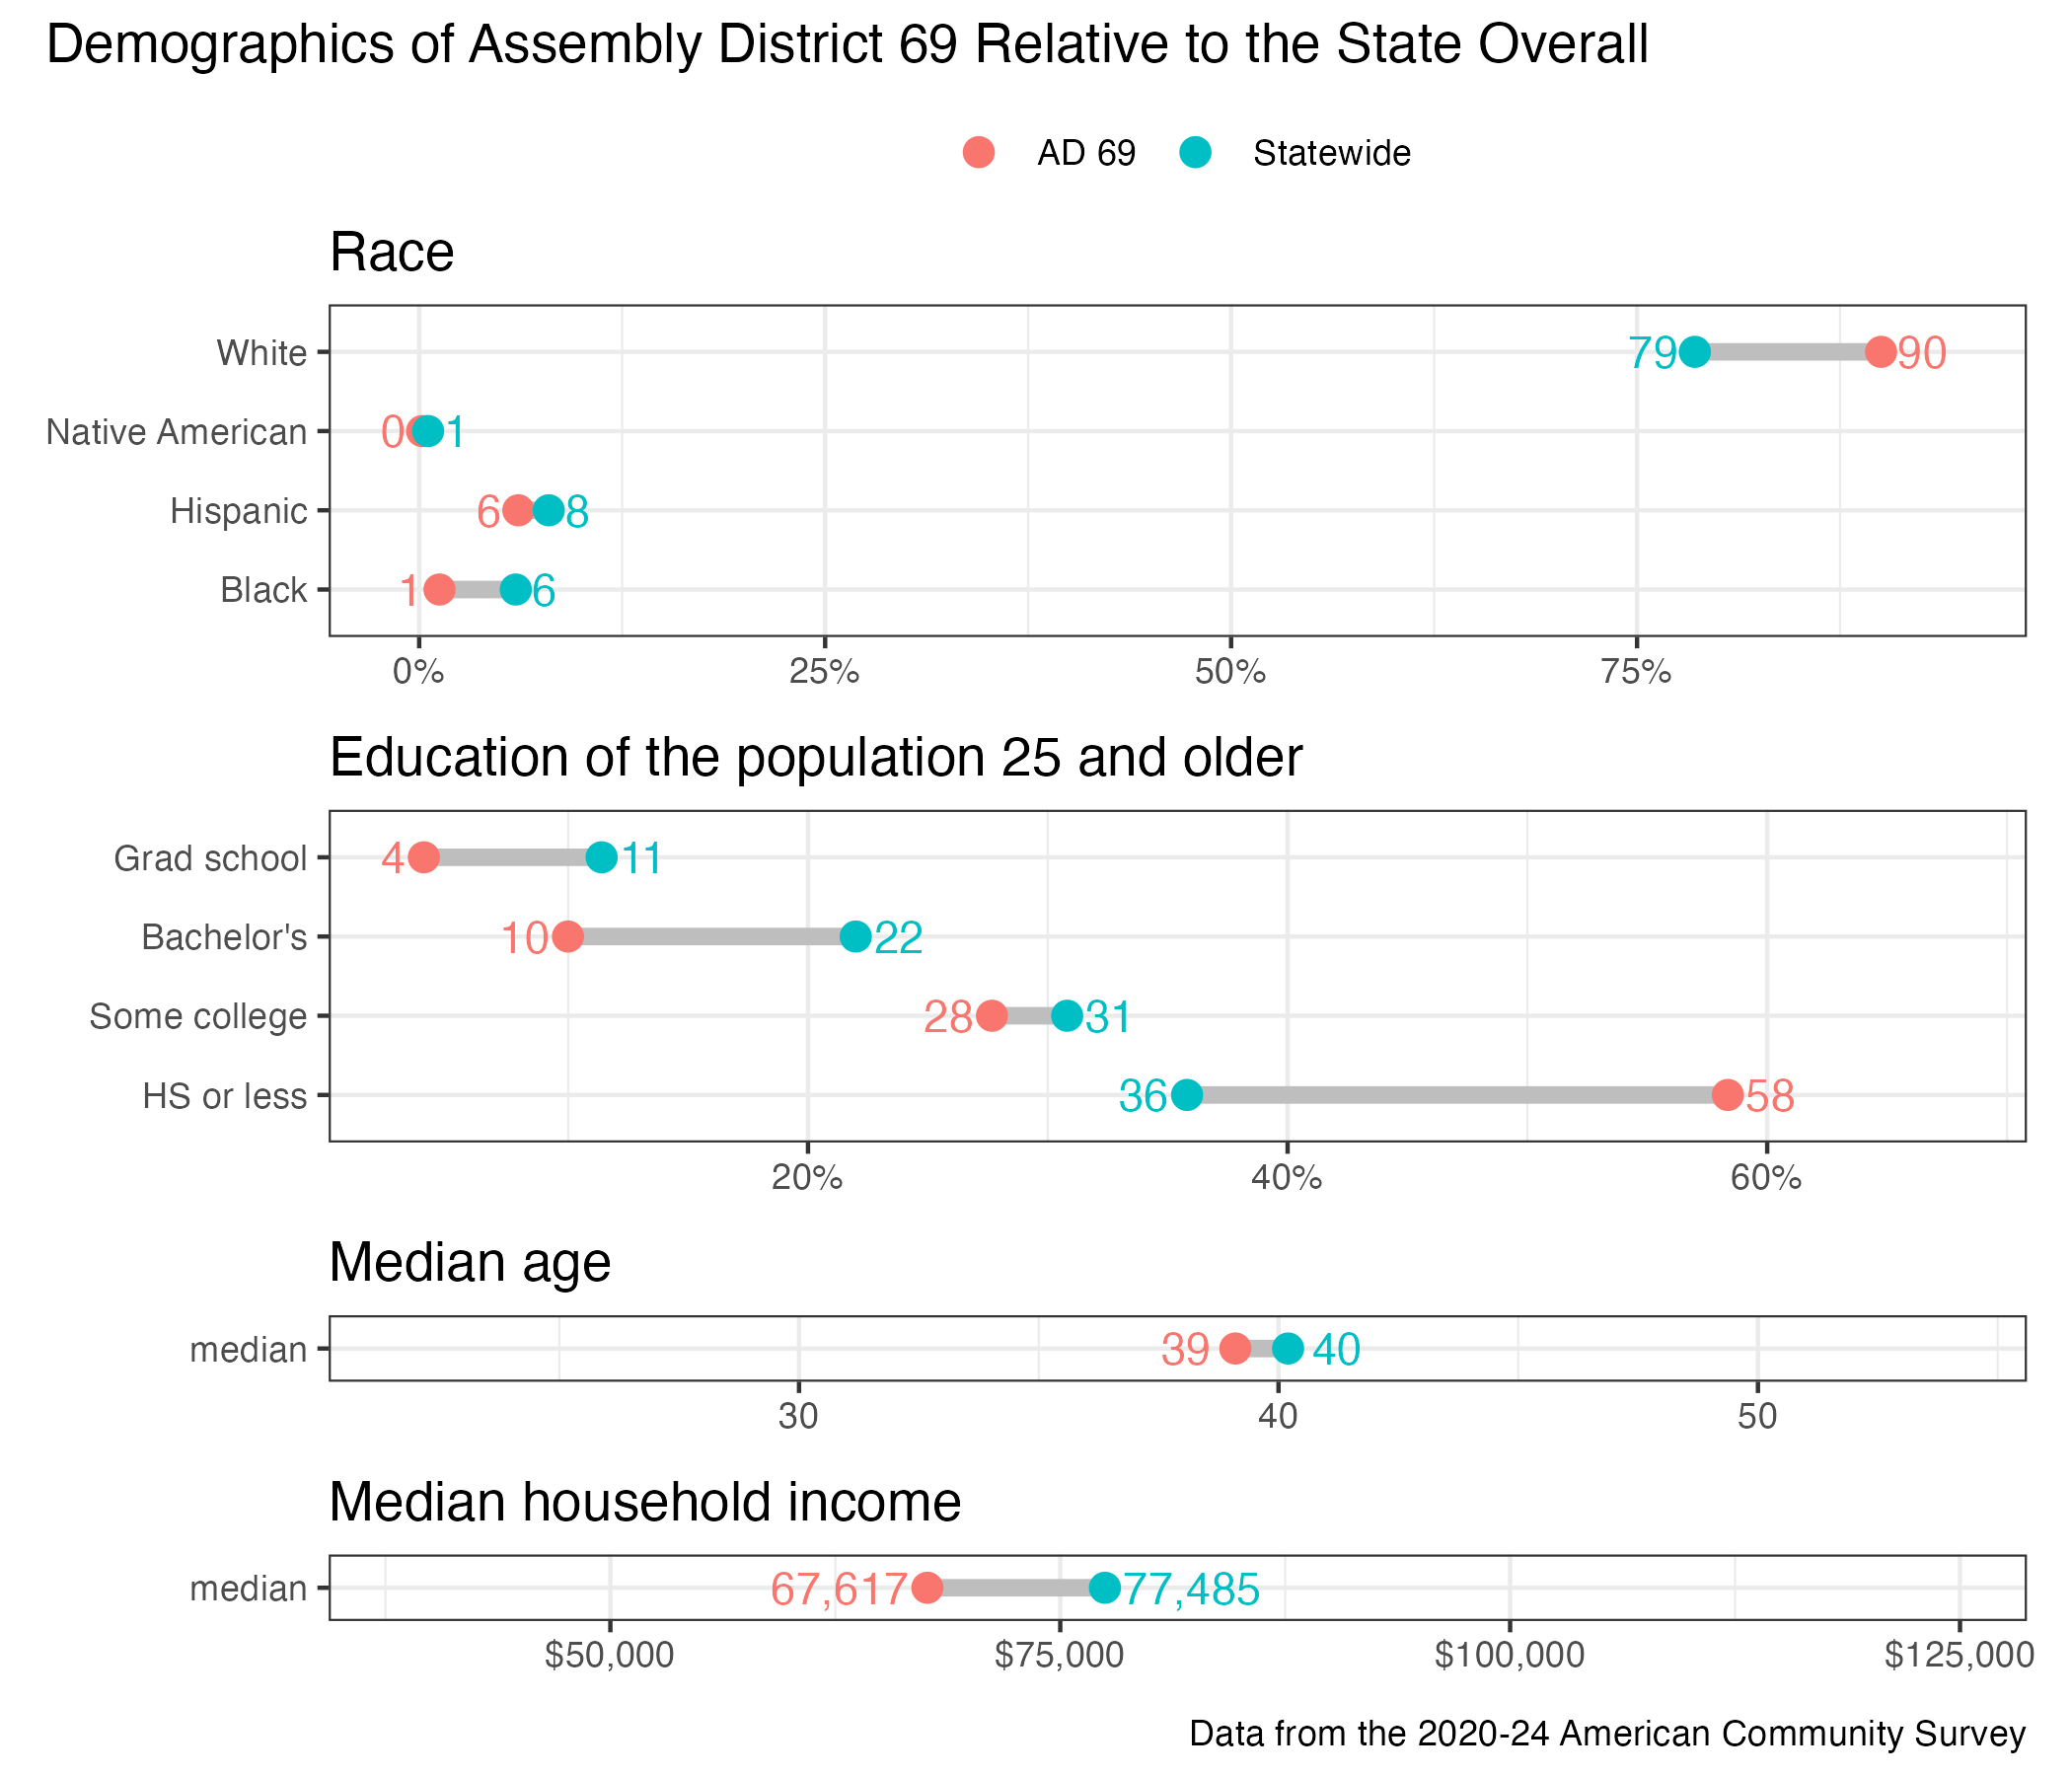
District demographics