83rd Assembly District
District
Candidates
| Assembly District 83 Candidates on the Primary Ballot | ||
| Incumbent: Dave Maxey | ||
Jan 1 thru July 30
|
||
|---|---|---|
| receipts | disbursements | |
| Republican | ||
| Dave Maxey | $2,466.33 | $13,541.01 |
| Data from the 2026 July Continuing Report. Any amended reports might not yet be shown. | ||
Past election results
| Election Results in Wisconsin State Assembly District 83 | ||||||
votes
|
Dem. %1 |
margin (Dem. - Rep.)
|
||||
|---|---|---|---|---|---|---|
| total | Dem. | Rep. | votes | points2 | ||
| 2016 President | 36,394 | 12,807 | 21,208 | 37.7% | −8,401 | −24.7 |
| 2016 Senator | 36,380 | 11,747 | 23,947 | 32.9% | −12,200 | −34.2 |
| 2018 Governor | 33,911 | 11,685 | 21,783 | 34.9% | −10,098 | −30.2 |
| 2018 Senator | 33,742 | 13,627 | 20,067 | 40.4% | −6,440 | −19.1 |
| 2020 President | 40,447 | 16,299 | 23,484 | 41.0% | −7,185 | −18.1 |
| 2022 Governor | 34,032 | 13,884 | 19,883 | 41.1% | −5,999 | −17.8 |
| 2022 Senator | 33,921 | 13,119 | 20,724 | 38.8% | −7,605 | −22.5 |
| 2024 President | 40,563 | 16,458 | 23,499 | 41.2% | −7,041 | −17.6 |
| 2024 Senator | 40,205 | 16,107 | 23,463 | 40.7% | −7,356 | −18.6 |
| 2024 WI Assembly | 39,019 | 15,194 | 23,772 | 39.0% | −8,578 | −22.0 |
| 2025 WI Sup. Ct.3 | 29,745 | 13,072 | 16,662 | 44.0% | −3,590 | −12.1 |
| 1 Share of the two-party vote. For Rep. share, subtract from 100. | ||||||
| 2 Dem % of the two-party vote minus Rep % of the two-party vote | ||||||
| 3 Formally nonpartisan candidates assigned party labels based on state endorsements | ||||||
| Election results allocated into 2024 district boundaries based on population overlap. Calculations by John Johnson (johndjohnson.info). | ||||||
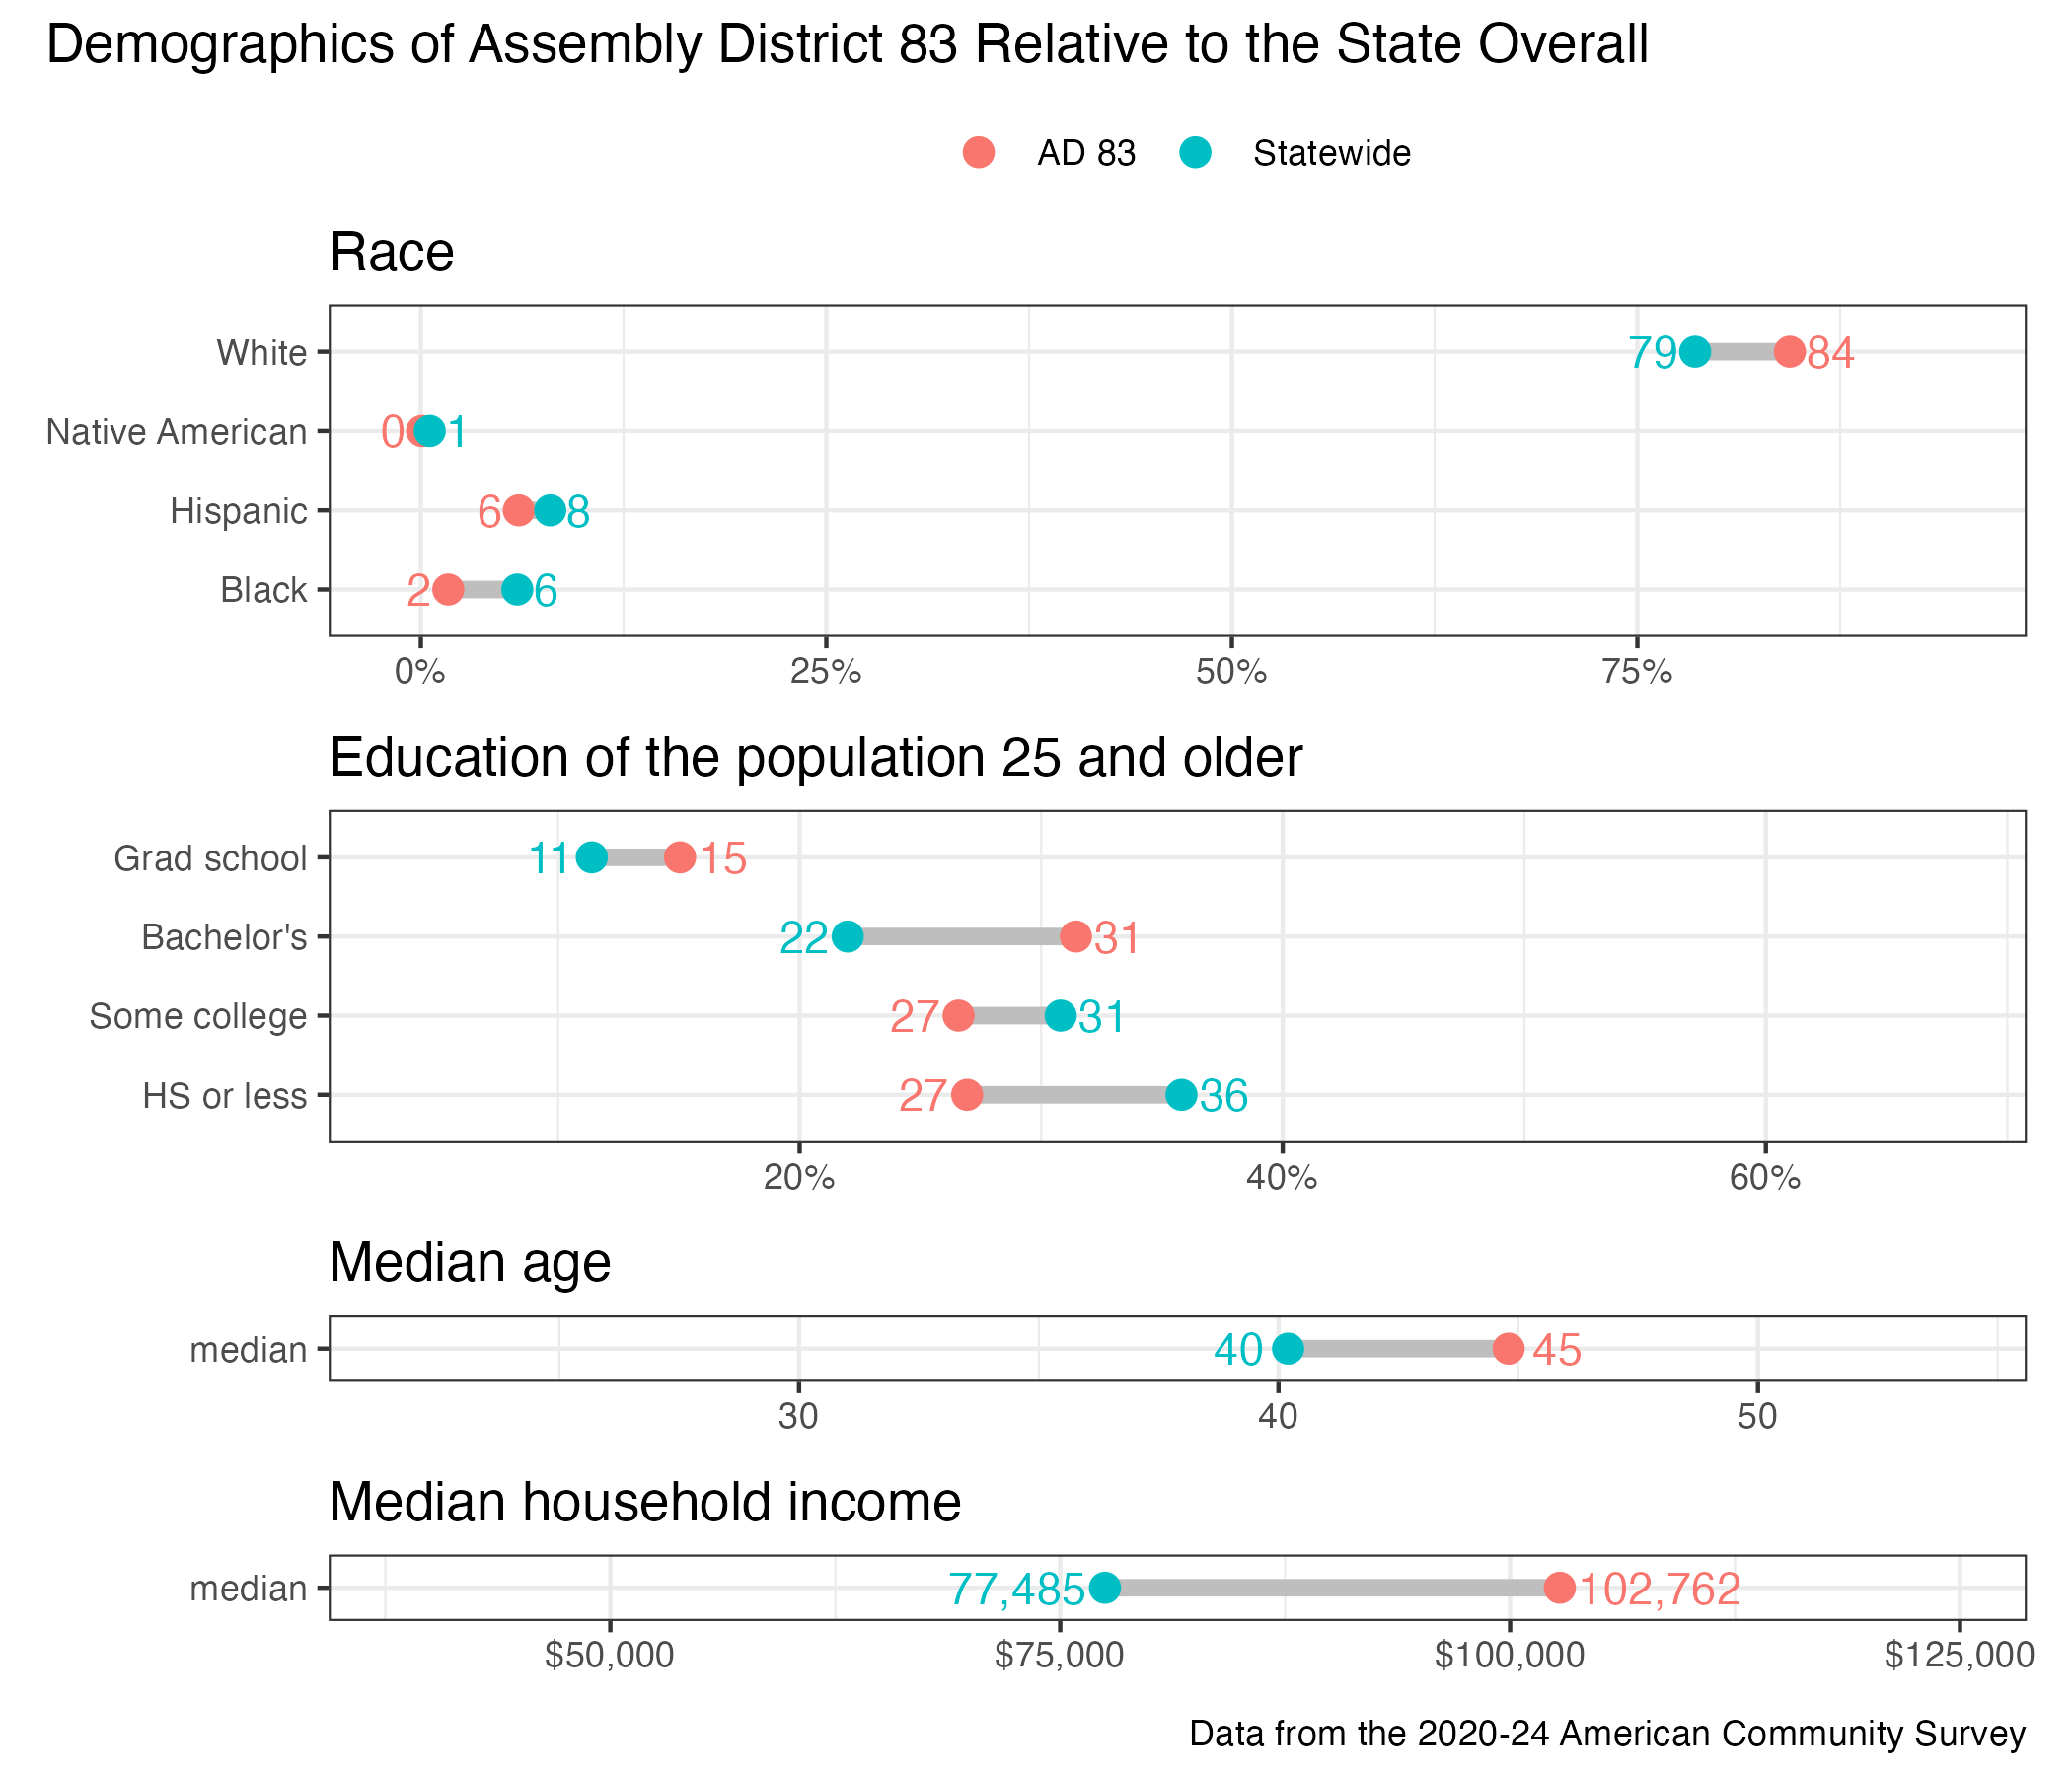
District demographics