37th Assembly District
District
Candidates
| Assembly District 37 Candidates on the Primary Ballot | ||
| Incumbent: Mark L. Born | ||
Jan 1 thru July 30
|
||
|---|---|---|
| receipts | disbursements | |
| Republican | ||
| Mark Born | $55,320.00 | $10,049.24 |
| Steve Rydzewski | $5,970.00 | $4,600.73 |
| Democratic | ||
| LaToya Bates | $700.00 | $0.00 |
| Data from the 2026 July Continuing Report. Any amended reports might not yet be shown. | ||
Past election results
| Election Results in Wisconsin State Assembly District 37 | ||||||
votes
|
Dem. %1 |
margin (Dem. - Rep.)
|
||||
|---|---|---|---|---|---|---|
| total | Dem. | Rep. | votes | points2 | ||
| 2016 President | 27,073 | 9,420 | 16,046 | 37.0% | −6,626 | −26.0 |
| 2016 Senator | 27,080 | 10,030 | 16,170 | 38.3% | −6,140 | −23.4 |
| 2018 Governor | 23,549 | 9,396 | 13,707 | 40.7% | −4,311 | −18.7 |
| 2018 Senator | 23,297 | 10,707 | 12,586 | 46.0% | −1,879 | −8.1 |
| 2020 President | 30,490 | 11,040 | 18,994 | 36.8% | −7,954 | −26.5 |
| 2022 Governor | 24,477 | 8,923 | 15,303 | 36.8% | −6,380 | −26.3 |
| 2022 Senator | 24,294 | 8,699 | 15,587 | 35.8% | −6,888 | −28.4 |
| 2024 President | 31,676 | 11,116 | 20,115 | 35.6% | −8,999 | −28.8 |
| 2024 Senator | 31,383 | 11,300 | 19,303 | 36.9% | −8,003 | −26.2 |
| 2024 WI Assembly | 30,589 | 9,608 | 20,977 | 31.4% | −11,369 | −37.2 |
| 2025 WI Sup. Ct.3 | 20,857 | 8,478 | 12,379 | 40.6% | −3,901 | −18.7 |
| 1 Share of the two-party vote. For Rep. share, subtract from 100. | ||||||
| 2 Dem % of the two-party vote minus Rep % of the two-party vote | ||||||
| 3 Formally nonpartisan candidates assigned party labels based on state endorsements | ||||||
| Election results allocated into 2024 district boundaries based on population overlap. Calculations by John Johnson (johndjohnson.info). | ||||||
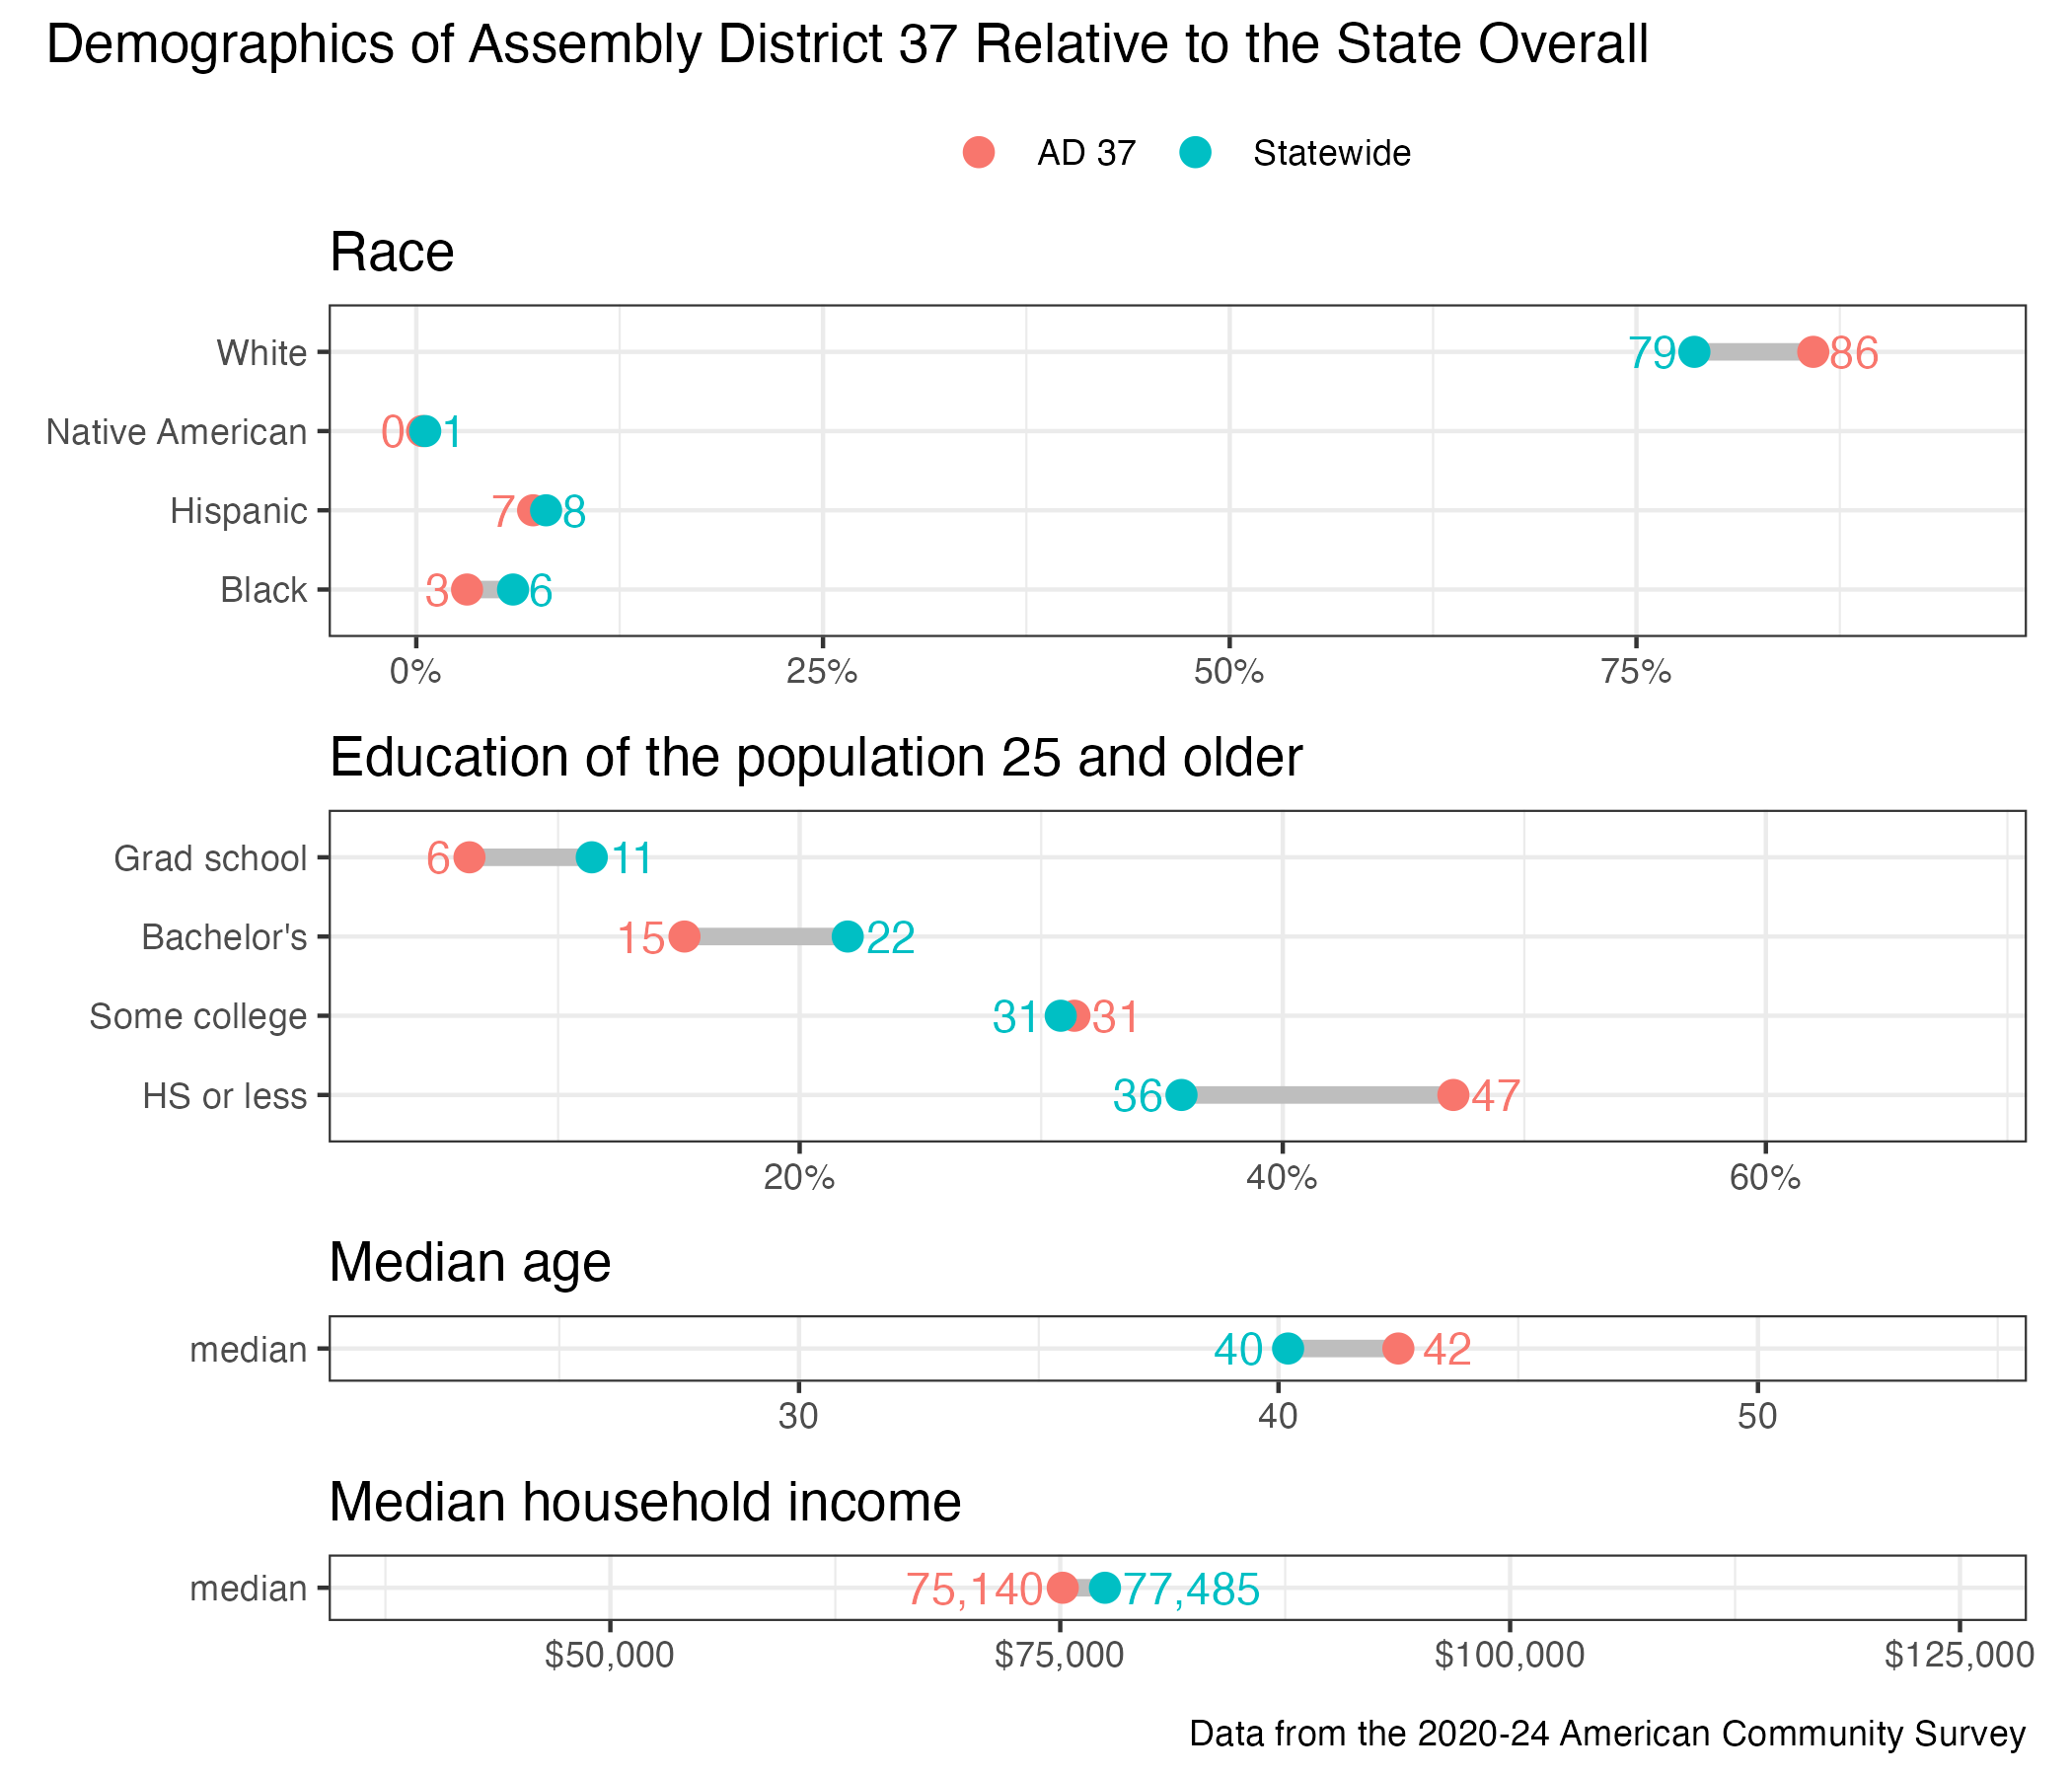
District demographics