65th Assembly District
District
Candidates
| Assembly District 65 Candidates on the Primary Ballot | ||
| Incumbent: Ben DeSmidt | ||
Jan 1 thru July 30
|
||
|---|---|---|
| receipts | disbursements | |
| Republican | ||
| Valerie Kretchmer | $2,410.00 | $1,146.02 |
| Democratic | ||
| Ben DeSmidt | $18,826.00 | $10,863.83 |
| Data from the 2026 July Continuing Report. Any amended reports might not yet be shown. | ||
Past election results
| Election Results in Wisconsin State Assembly District 65 | ||||||
votes
|
Dem. %1 |
margin (Dem. - Rep.)
|
||||
|---|---|---|---|---|---|---|
| total | Dem. | Rep. | votes | points2 | ||
| 2016 President | 26,405 | 13,914 | 10,910 | 56.1% | +3,004 | +12.1 |
| 2016 Senator | 26,280 | 13,958 | 11,369 | 55.1% | +2,589 | +10.2 |
| 2018 Governor | 23,622 | 13,535 | 9,317 | 59.2% | +4,218 | +18.5 |
| 2018 Senator | 23,416 | 14,700 | 8,689 | 62.9% | +6,011 | +25.7 |
| 2020 President | 29,819 | 16,041 | 13,262 | 54.7% | +2,779 | +9.5 |
| 2022 Governor | 21,611 | 11,996 | 9,324 | 56.3% | +2,672 | +12.5 |
| 2022 Senator | 21,564 | 11,749 | 9,760 | 54.6% | +1,989 | +9.2 |
| 2024 President | 29,578 | 15,612 | 13,535 | 53.6% | +2,077 | +7.1 |
| 2024 Senator | 29,218 | 15,571 | 12,788 | 54.9% | +2,783 | +9.8 |
| 2024 WI Assembly | 28,283 | 15,065 | 13,166 | 53.4% | +1,899 | +6.7 |
| 2025 WI Sup. Ct.3 | 18,811 | 11,160 | 7,628 | 59.4% | +3,532 | +18.8 |
| 1 Share of the two-party vote. For Rep. share, subtract from 100. | ||||||
| 2 Dem % of the two-party vote minus Rep % of the two-party vote | ||||||
| 3 Formally nonpartisan candidates assigned party labels based on state endorsements | ||||||
| Election results allocated into 2024 district boundaries based on population overlap. Calculations by John Johnson (johndjohnson.info). | ||||||
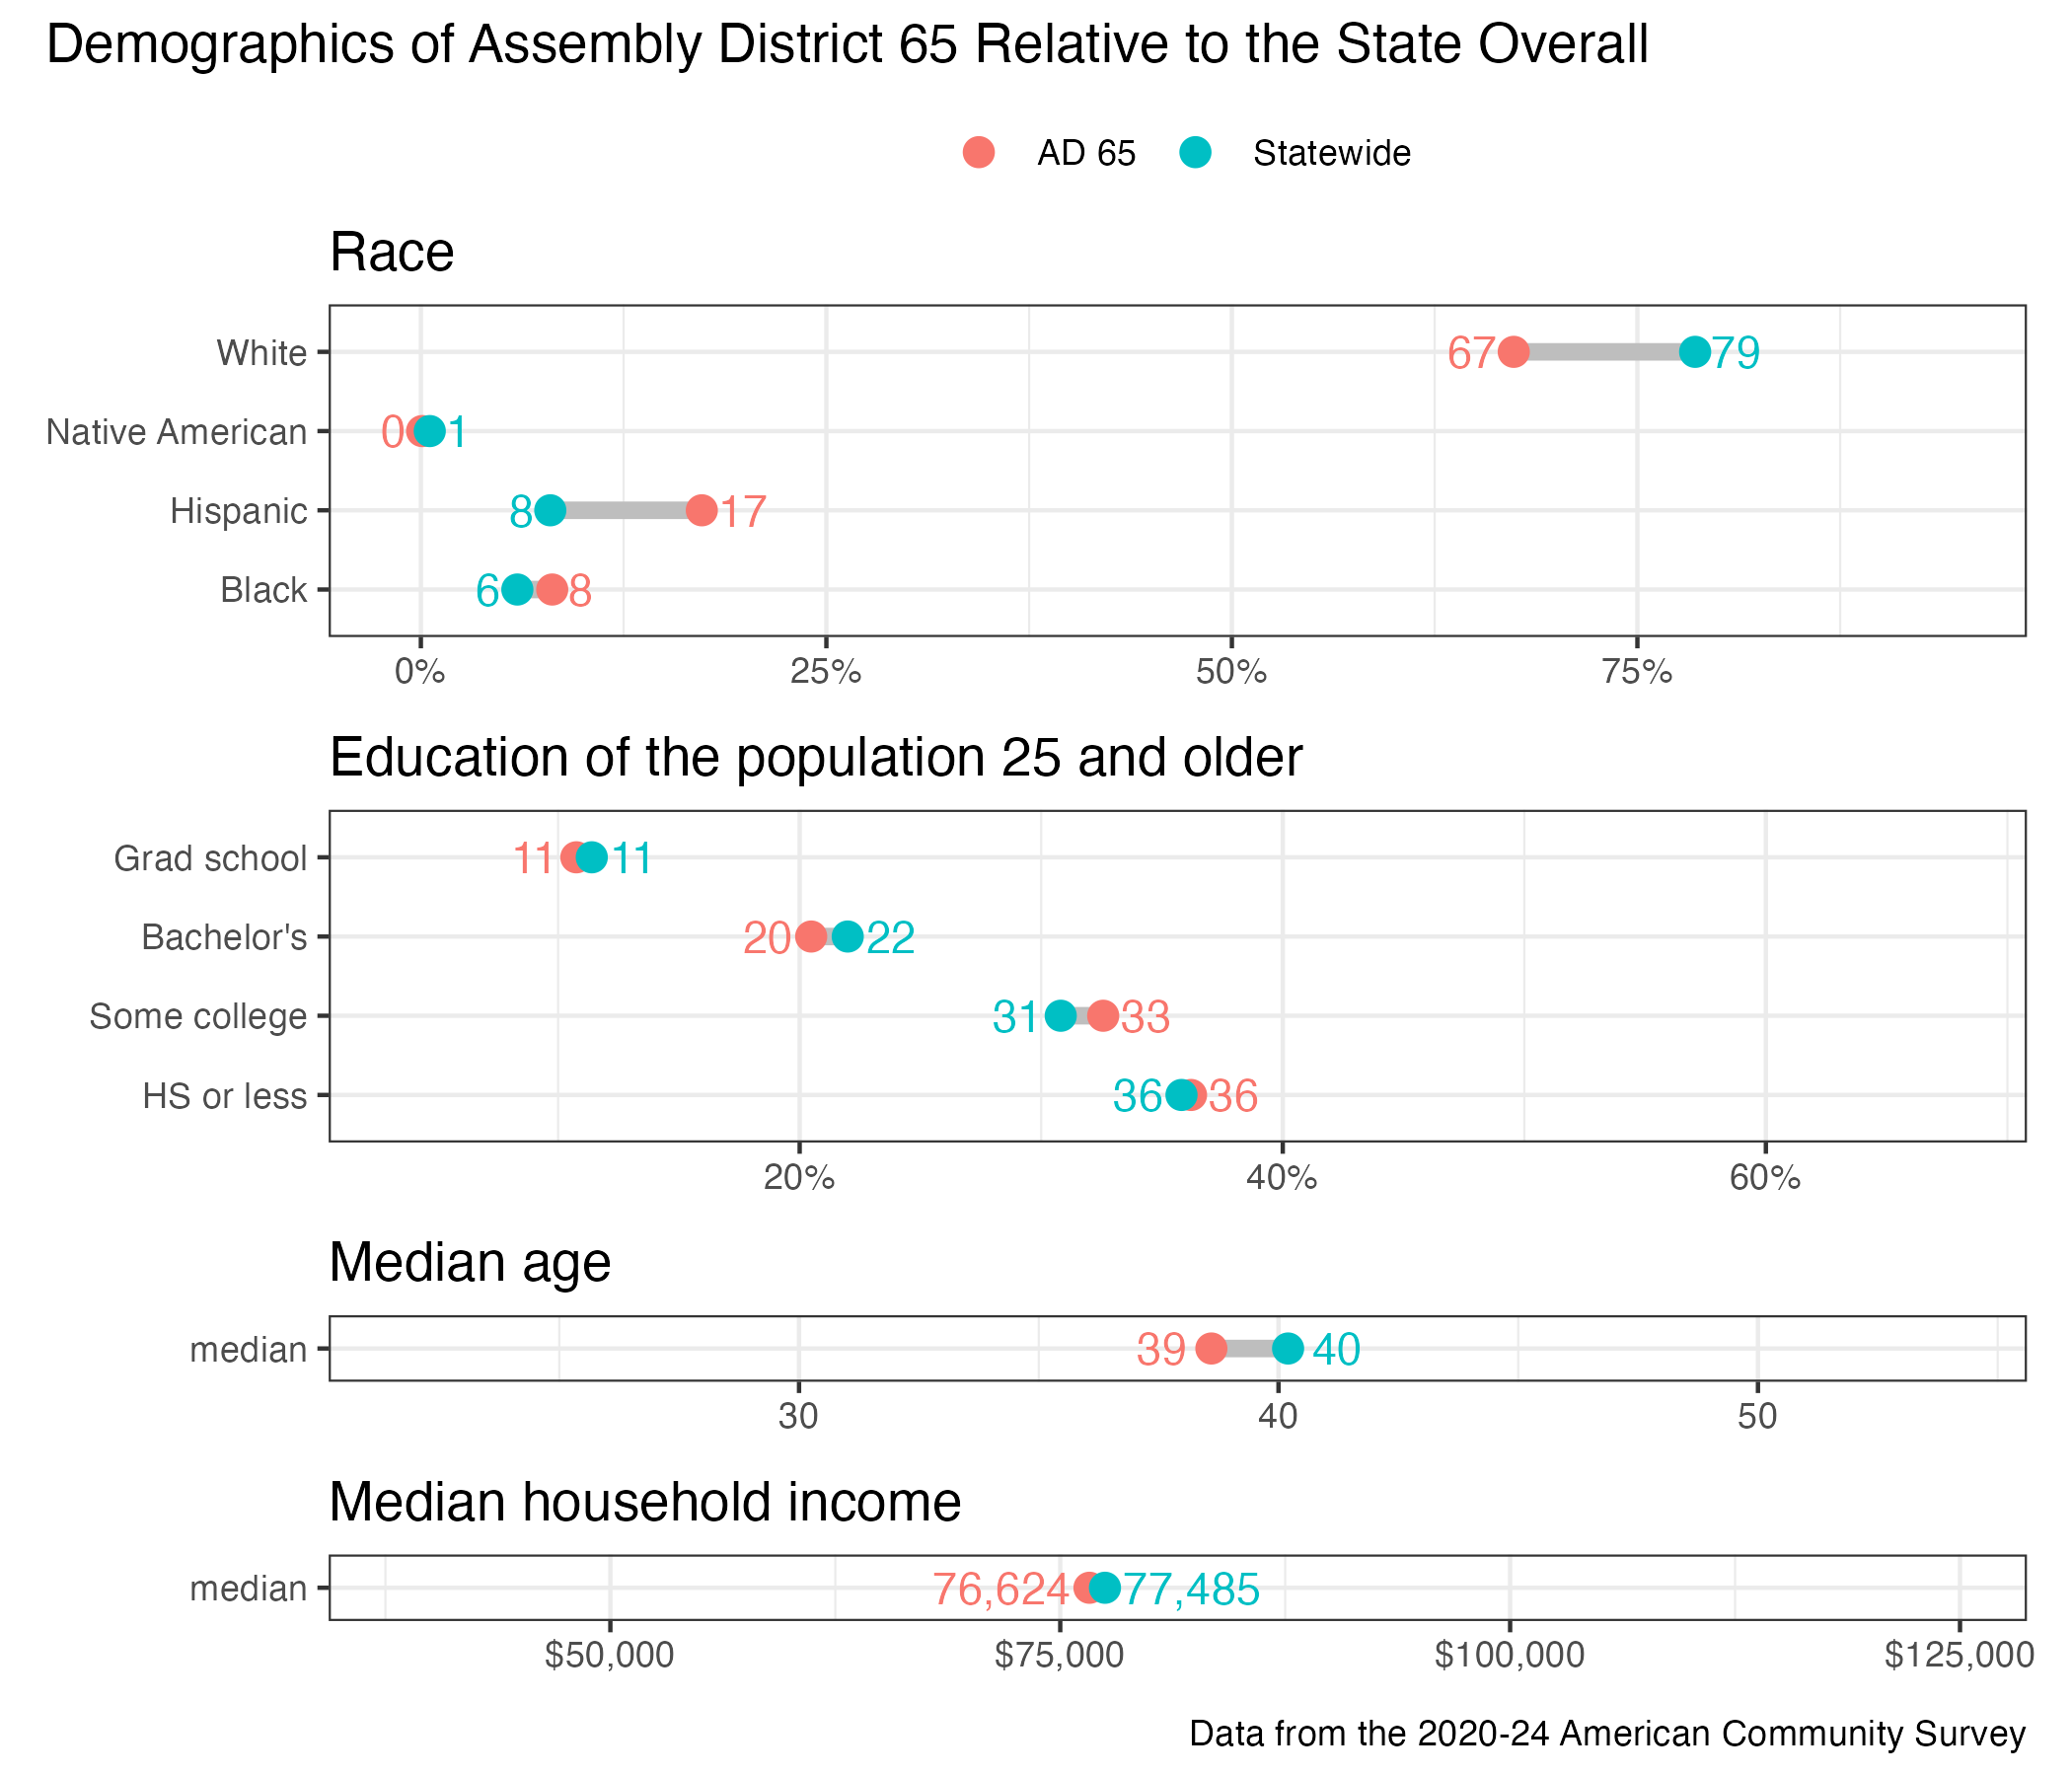
District demographics