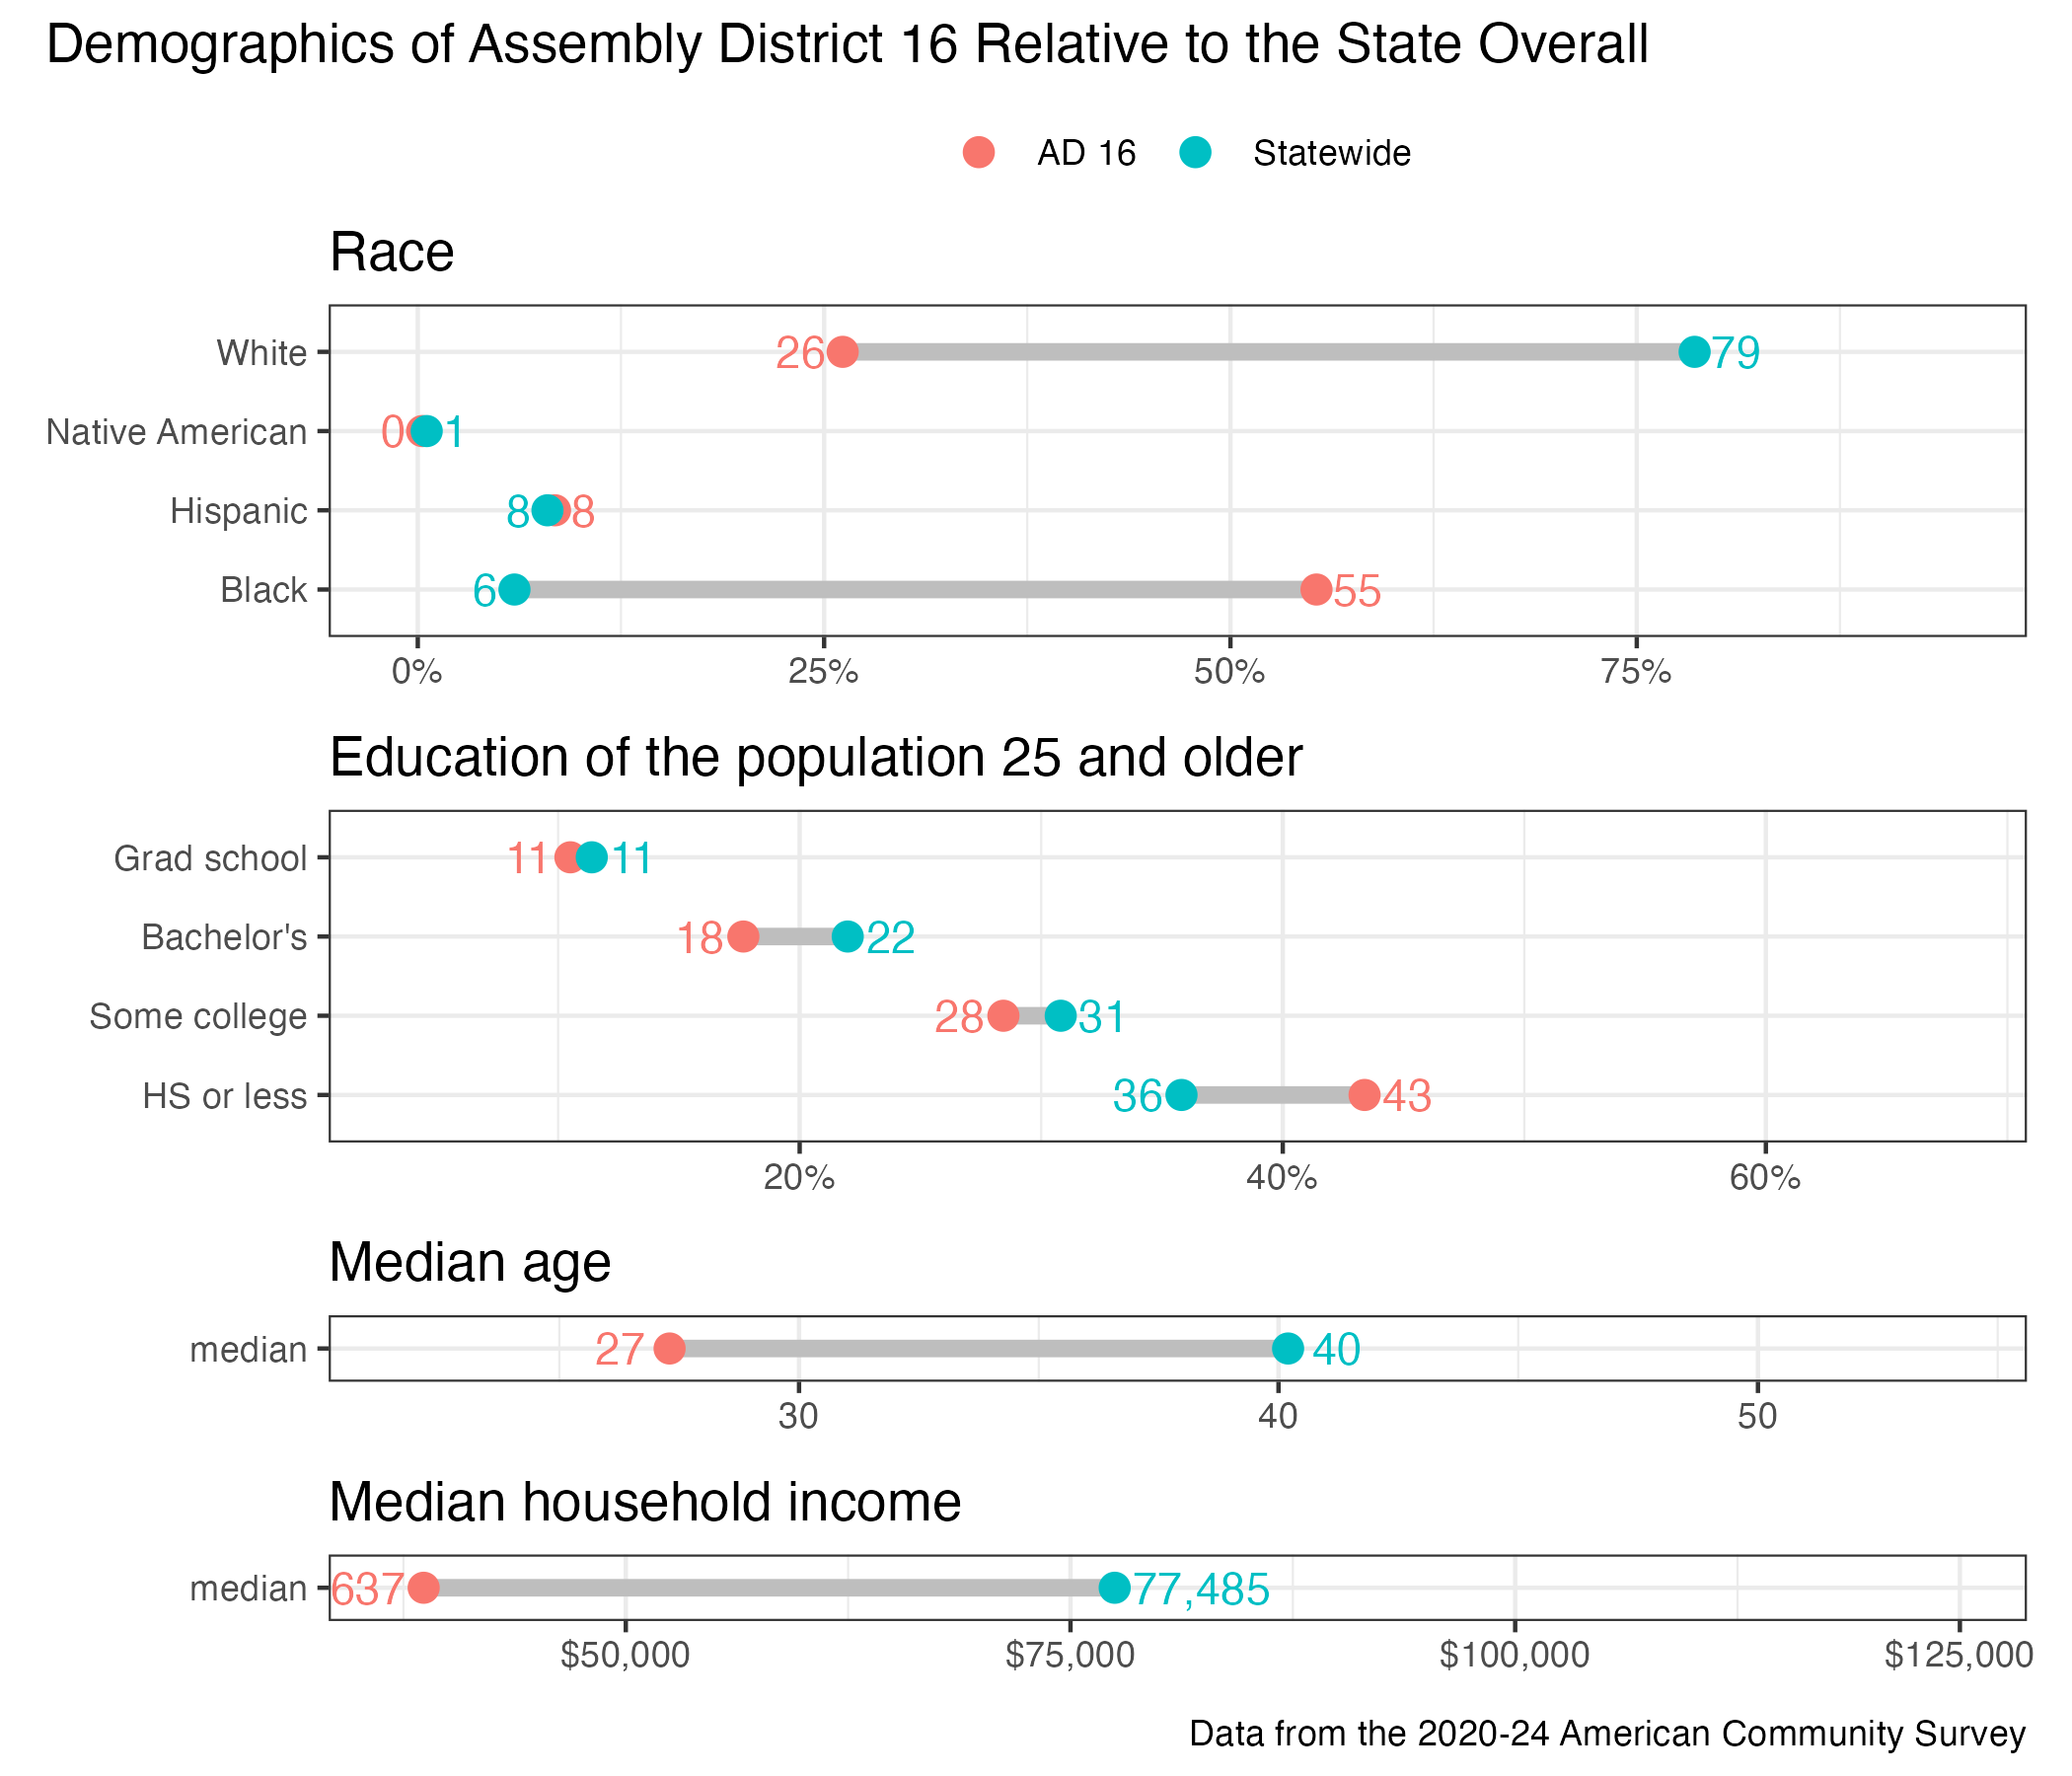
16th Assembly District
District
Candidates
| Assembly District 16 Candidates on the Primary Ballot | ||
| Incumbent: Kalan Haywood | ||
Jan 1 thru July 30
|
||
|---|---|---|
| receipts | disbursements | |
| Republican | ||
| Alciro Deacon | $0.00 | $0.00 |
| Democratic | ||
| Kalan Haywood | $23,643.01 | $4,867.47 |
| Data from the 2026 July Continuing Report. Any amended reports might not yet be shown. | ||
Past election results
| Election Results in Wisconsin State Assembly District 16 | ||||||
votes
|
Dem. %1 |
margin (Dem. - Rep.)
|
||||
|---|---|---|---|---|---|---|
| total | Dem. | Rep. | votes | points2 | ||
| 2016 President | 24,214 | 20,997 | 2,112 | 90.9% | +18,885 | +81.7 |
| 2016 Senator | 23,498 | 19,778 | 3,229 | 86.0% | +16,549 | +71.9 |
| 2018 Governor | 20,197 | 17,920 | 1,837 | 90.7% | +16,083 | +81.4 |
| 2018 Senator | 20,277 | 18,513 | 1,713 | 91.5% | +16,800 | +83.1 |
| 2020 President | 22,842 | 20,326 | 2,133 | 90.5% | +18,193 | +81.0 |
| 2022 Governor | 15,627 | 14,240 | 1,233 | 92.0% | +13,007 | +84.1 |
| 2022 Senator | 15,833 | 14,493 | 1,314 | 91.7% | +13,179 | +83.4 |
| 2024 President | 23,842 | 20,219 | 3,164 | 86.5% | +17,055 | +72.9 |
| 2024 Senator | 23,393 | 19,941 | 2,850 | 87.5% | +17,091 | +75.0 |
| 2024 WI Assembly | 20,350 | 20,079 | 0 | 100.0% | +20,079 | +100.0 |
| 2025 WI Sup. Ct.3 | 13,136 | 12,158 | 960 | 92.7% | +11,198 | +85.4 |
| 1 Share of the two-party vote. For Rep. share, subtract from 100. | ||||||
| 2 Dem % of the two-party vote minus Rep % of the two-party vote | ||||||
| 3 Formally nonpartisan candidates assigned party labels based on state endorsements | ||||||
| Election results allocated into 2024 district boundaries based on population overlap. Calculations by John Johnson (johndjohnson.info). | ||||||
District demographics