17th Assembly District
District
Candidates
| Assembly District 17 Candidates on the Primary Ballot | ||
| Incumbent: Supreme Moore Omokunde | ||
Jan 1 thru July 30
|
||
|---|---|---|
| receipts | disbursements | |
| Republican | ||
| Charlene Abughrin | $800.00 | $700.00 |
| Democratic | ||
| Supreme Moore Omokunde | $150.00 | $0.00 |
| Data from the 2026 July Continuing Report. Any amended reports might not yet be shown. | ||
Past election results
| Election Results in Wisconsin State Assembly District 17 | ||||||
votes
|
Dem. %1 |
margin (Dem. - Rep.)
|
||||
|---|---|---|---|---|---|---|
| total | Dem. | Rep. | votes | points2 | ||
| 2016 President | 29,931 | 24,324 | 4,415 | 84.6% | +19,909 | +69.3 |
| 2016 Senator | 29,484 | 23,479 | 5,531 | 80.9% | +17,948 | +61.9 |
| 2018 Governor | 26,192 | 21,376 | 4,395 | 82.9% | +16,981 | +65.9 |
| 2018 Senator | 26,302 | 22,317 | 3,957 | 84.9% | +18,360 | +69.9 |
| 2020 President | 30,321 | 25,315 | 4,578 | 84.7% | +20,737 | +69.4 |
| 2022 Governor | 21,830 | 18,493 | 3,108 | 85.6% | +15,385 | +71.2 |
| 2022 Senator | 22,013 | 18,708 | 3,270 | 85.1% | +15,438 | +70.2 |
| 2024 President | 29,665 | 24,599 | 4,556 | 84.4% | +20,043 | +68.7 |
| 2024 Senator | 29,309 | 24,397 | 4,269 | 85.1% | +20,128 | +70.2 |
| 2024 WI Assembly | 24,854 | 24,469 | 0 | 100.0% | +24,469 | +100.0 |
| 2025 WI Sup. Ct.3 | 18,551 | 16,070 | 2,466 | 86.7% | +13,604 | +73.4 |
| 1 Share of the two-party vote. For Rep. share, subtract from 100. | ||||||
| 2 Dem % of the two-party vote minus Rep % of the two-party vote | ||||||
| 3 Formally nonpartisan candidates assigned party labels based on state endorsements | ||||||
| Election results allocated into 2024 district boundaries based on population overlap. Calculations by John Johnson (johndjohnson.info). | ||||||
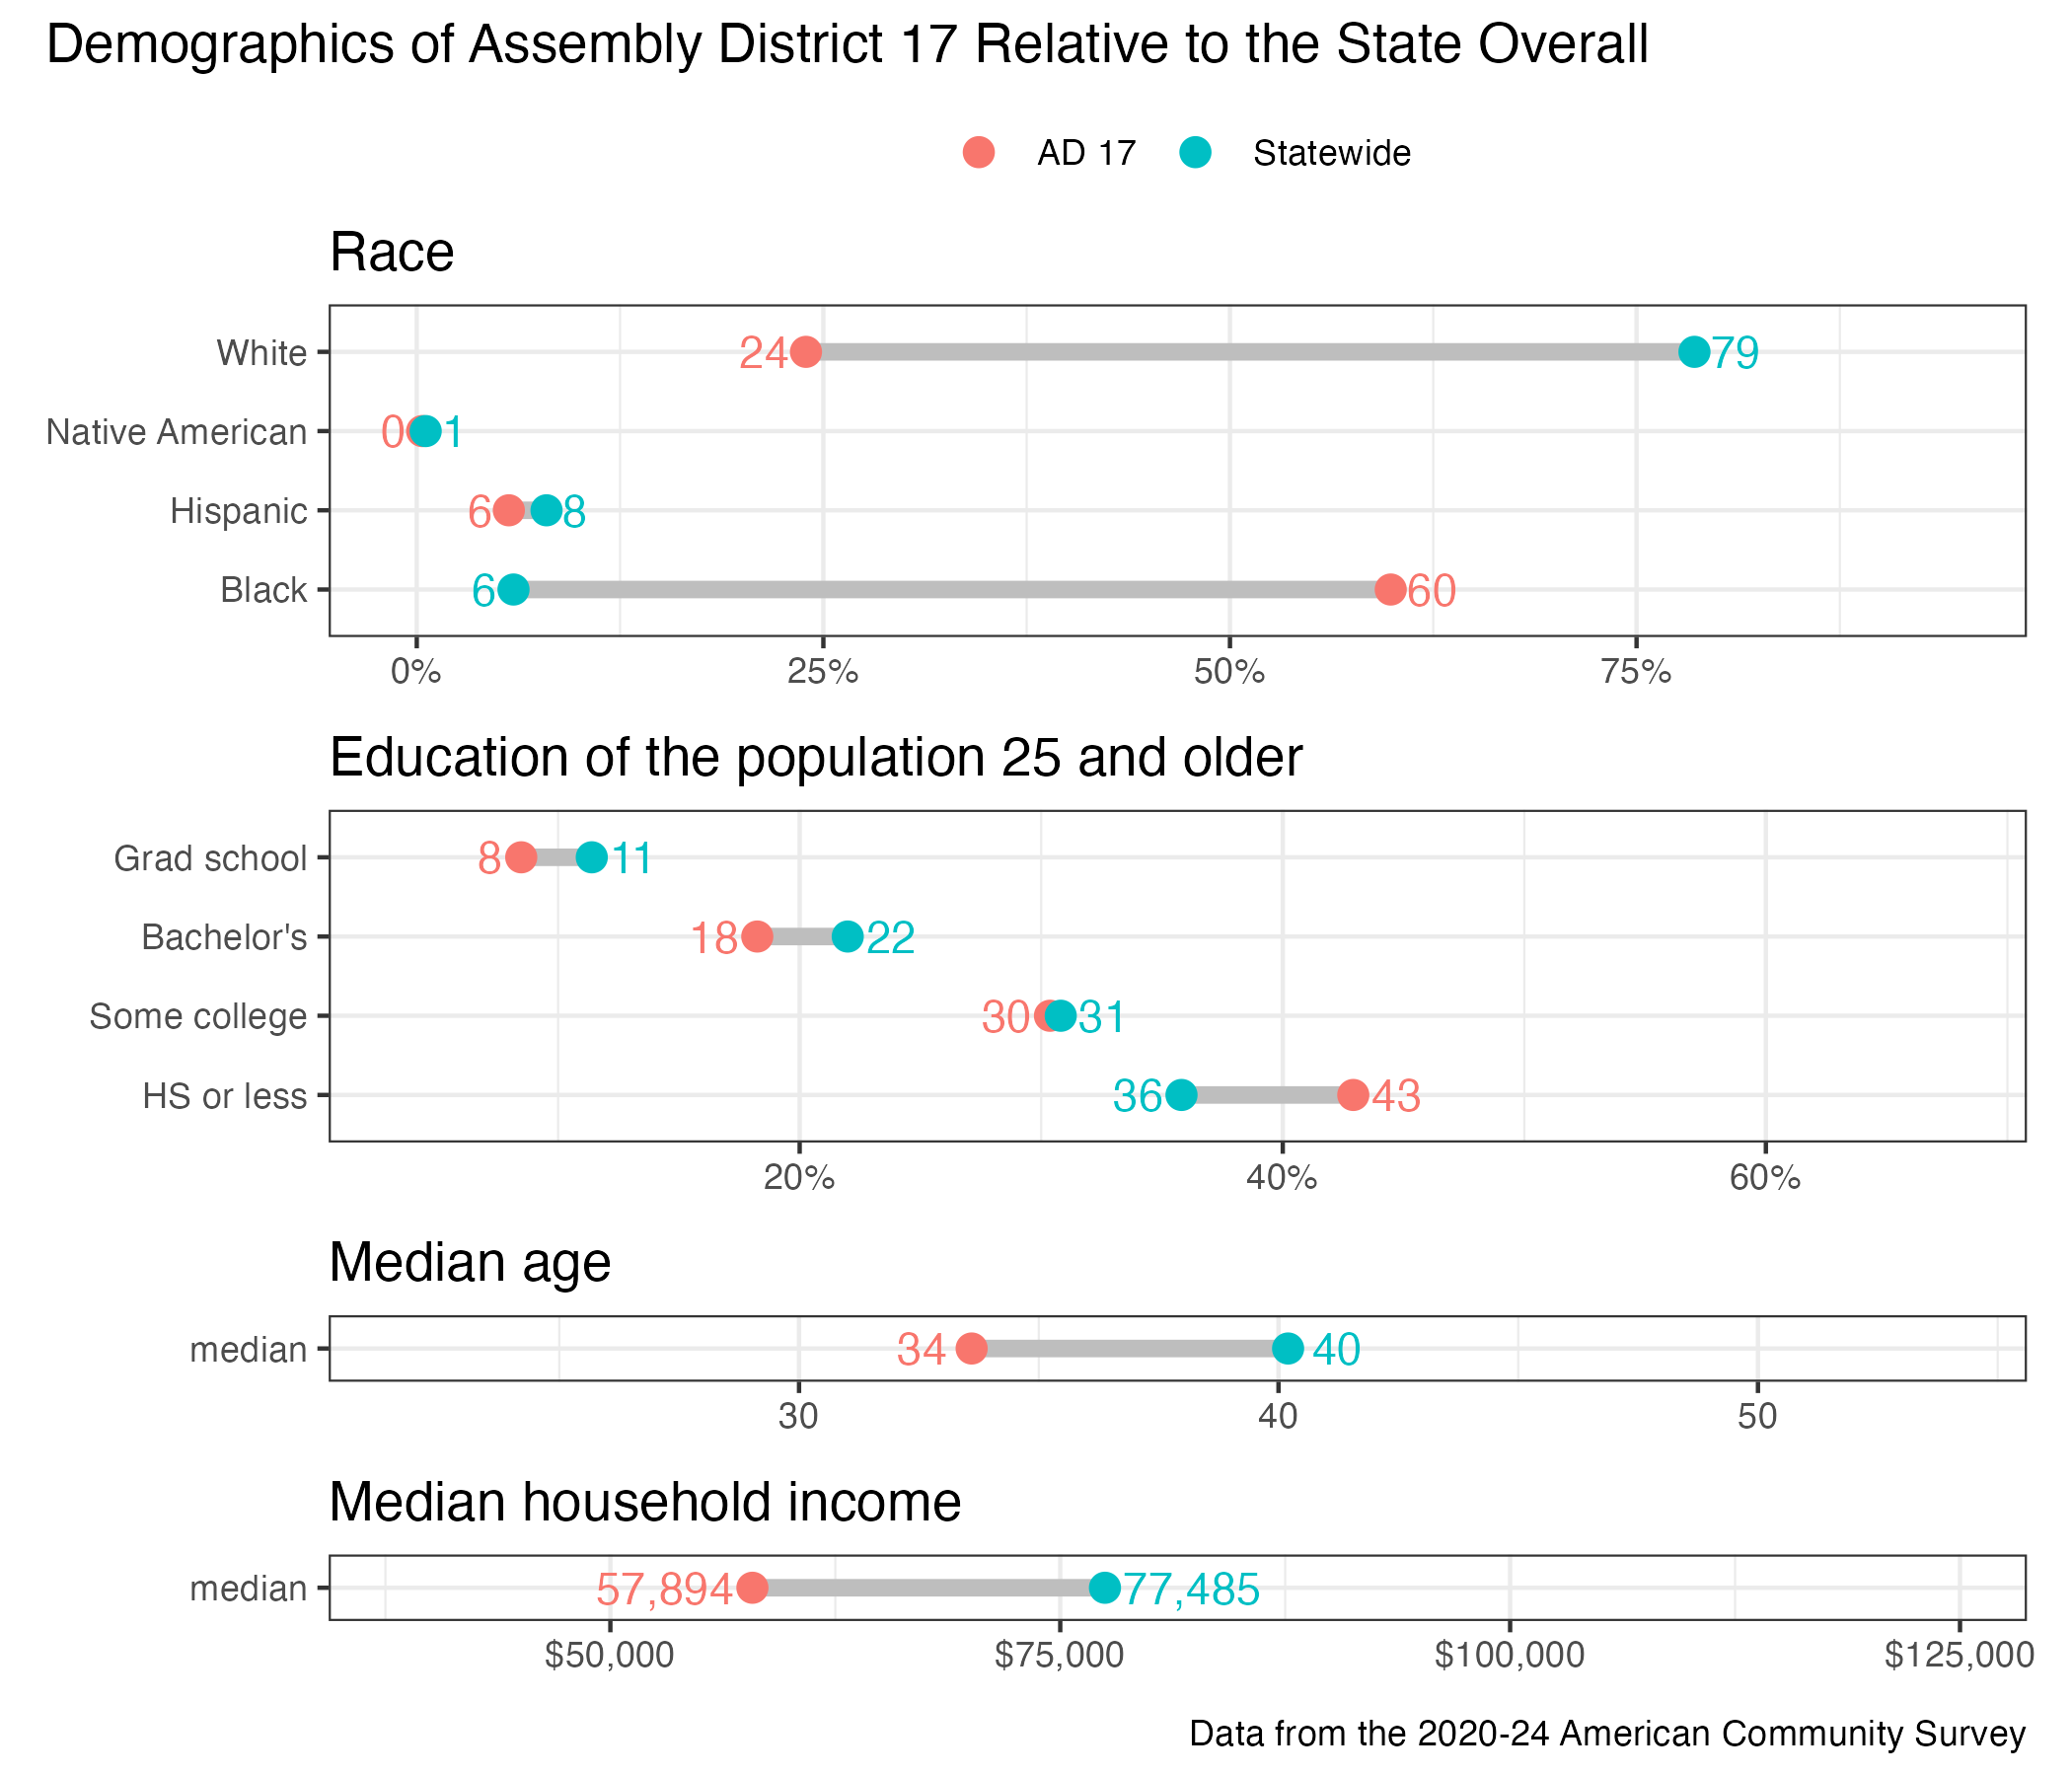
District demographics