46th Assembly District
District
Candidates
| Assembly District 46 Candidates on the Primary Ballot | ||
| Incumbent: Joan Fitzgerald | ||
Jan 1 thru July 30
|
||
|---|---|---|
| receipts | disbursements | |
| Republican | ||
| John Donohue | $523.88 | $265.70 |
| Democratic | ||
| Joan Fitzgerald | $21,780.00 | $3,619.29 |
| Data from the 2026 July Continuing Report. Any amended reports might not yet be shown. | ||
Past election results
| Election Results in Wisconsin State Assembly District 46 | ||||||
votes
|
Dem. %1 |
margin (Dem. - Rep.)
|
||||
|---|---|---|---|---|---|---|
| total | Dem. | Rep. | votes | points2 | ||
| 2016 President | 31,087 | 15,627 | 13,329 | 54.0% | +2,298 | +7.9 |
| 2016 Senator | 30,479 | 16,392 | 13,292 | 55.2% | +3,100 | +10.4 |
| 2018 Governor | 28,652 | 15,743 | 12,437 | 55.9% | +3,306 | +11.7 |
| 2018 Senator | 28,523 | 17,031 | 11,465 | 59.8% | +5,566 | +19.5 |
| 2020 President | 35,414 | 18,987 | 15,806 | 54.6% | +3,181 | +9.1 |
| 2022 Governor | 29,668 | 16,778 | 12,589 | 57.1% | +4,189 | +14.3 |
| 2022 Senator | 29,551 | 16,156 | 13,332 | 54.8% | +2,824 | +9.6 |
| 2024 President | 37,676 | 20,057 | 17,021 | 54.1% | +3,036 | +8.2 |
| 2024 Senator | 37,390 | 20,092 | 16,628 | 54.7% | +3,464 | +9.4 |
| 2024 WI Assembly | 36,236 | 18,985 | 17,219 | 52.4% | +1,766 | +4.9 |
| 2025 WI Sup. Ct.3 | 27,292 | 16,518 | 10,753 | 60.6% | +5,765 | +21.1 |
| 1 Share of the two-party vote. For Rep. share, subtract from 100. | ||||||
| 2 Dem % of the two-party vote minus Rep % of the two-party vote | ||||||
| 3 Formally nonpartisan candidates assigned party labels based on state endorsements | ||||||
| Election results allocated into 2024 district boundaries based on population overlap. Calculations by John Johnson (johndjohnson.info). | ||||||
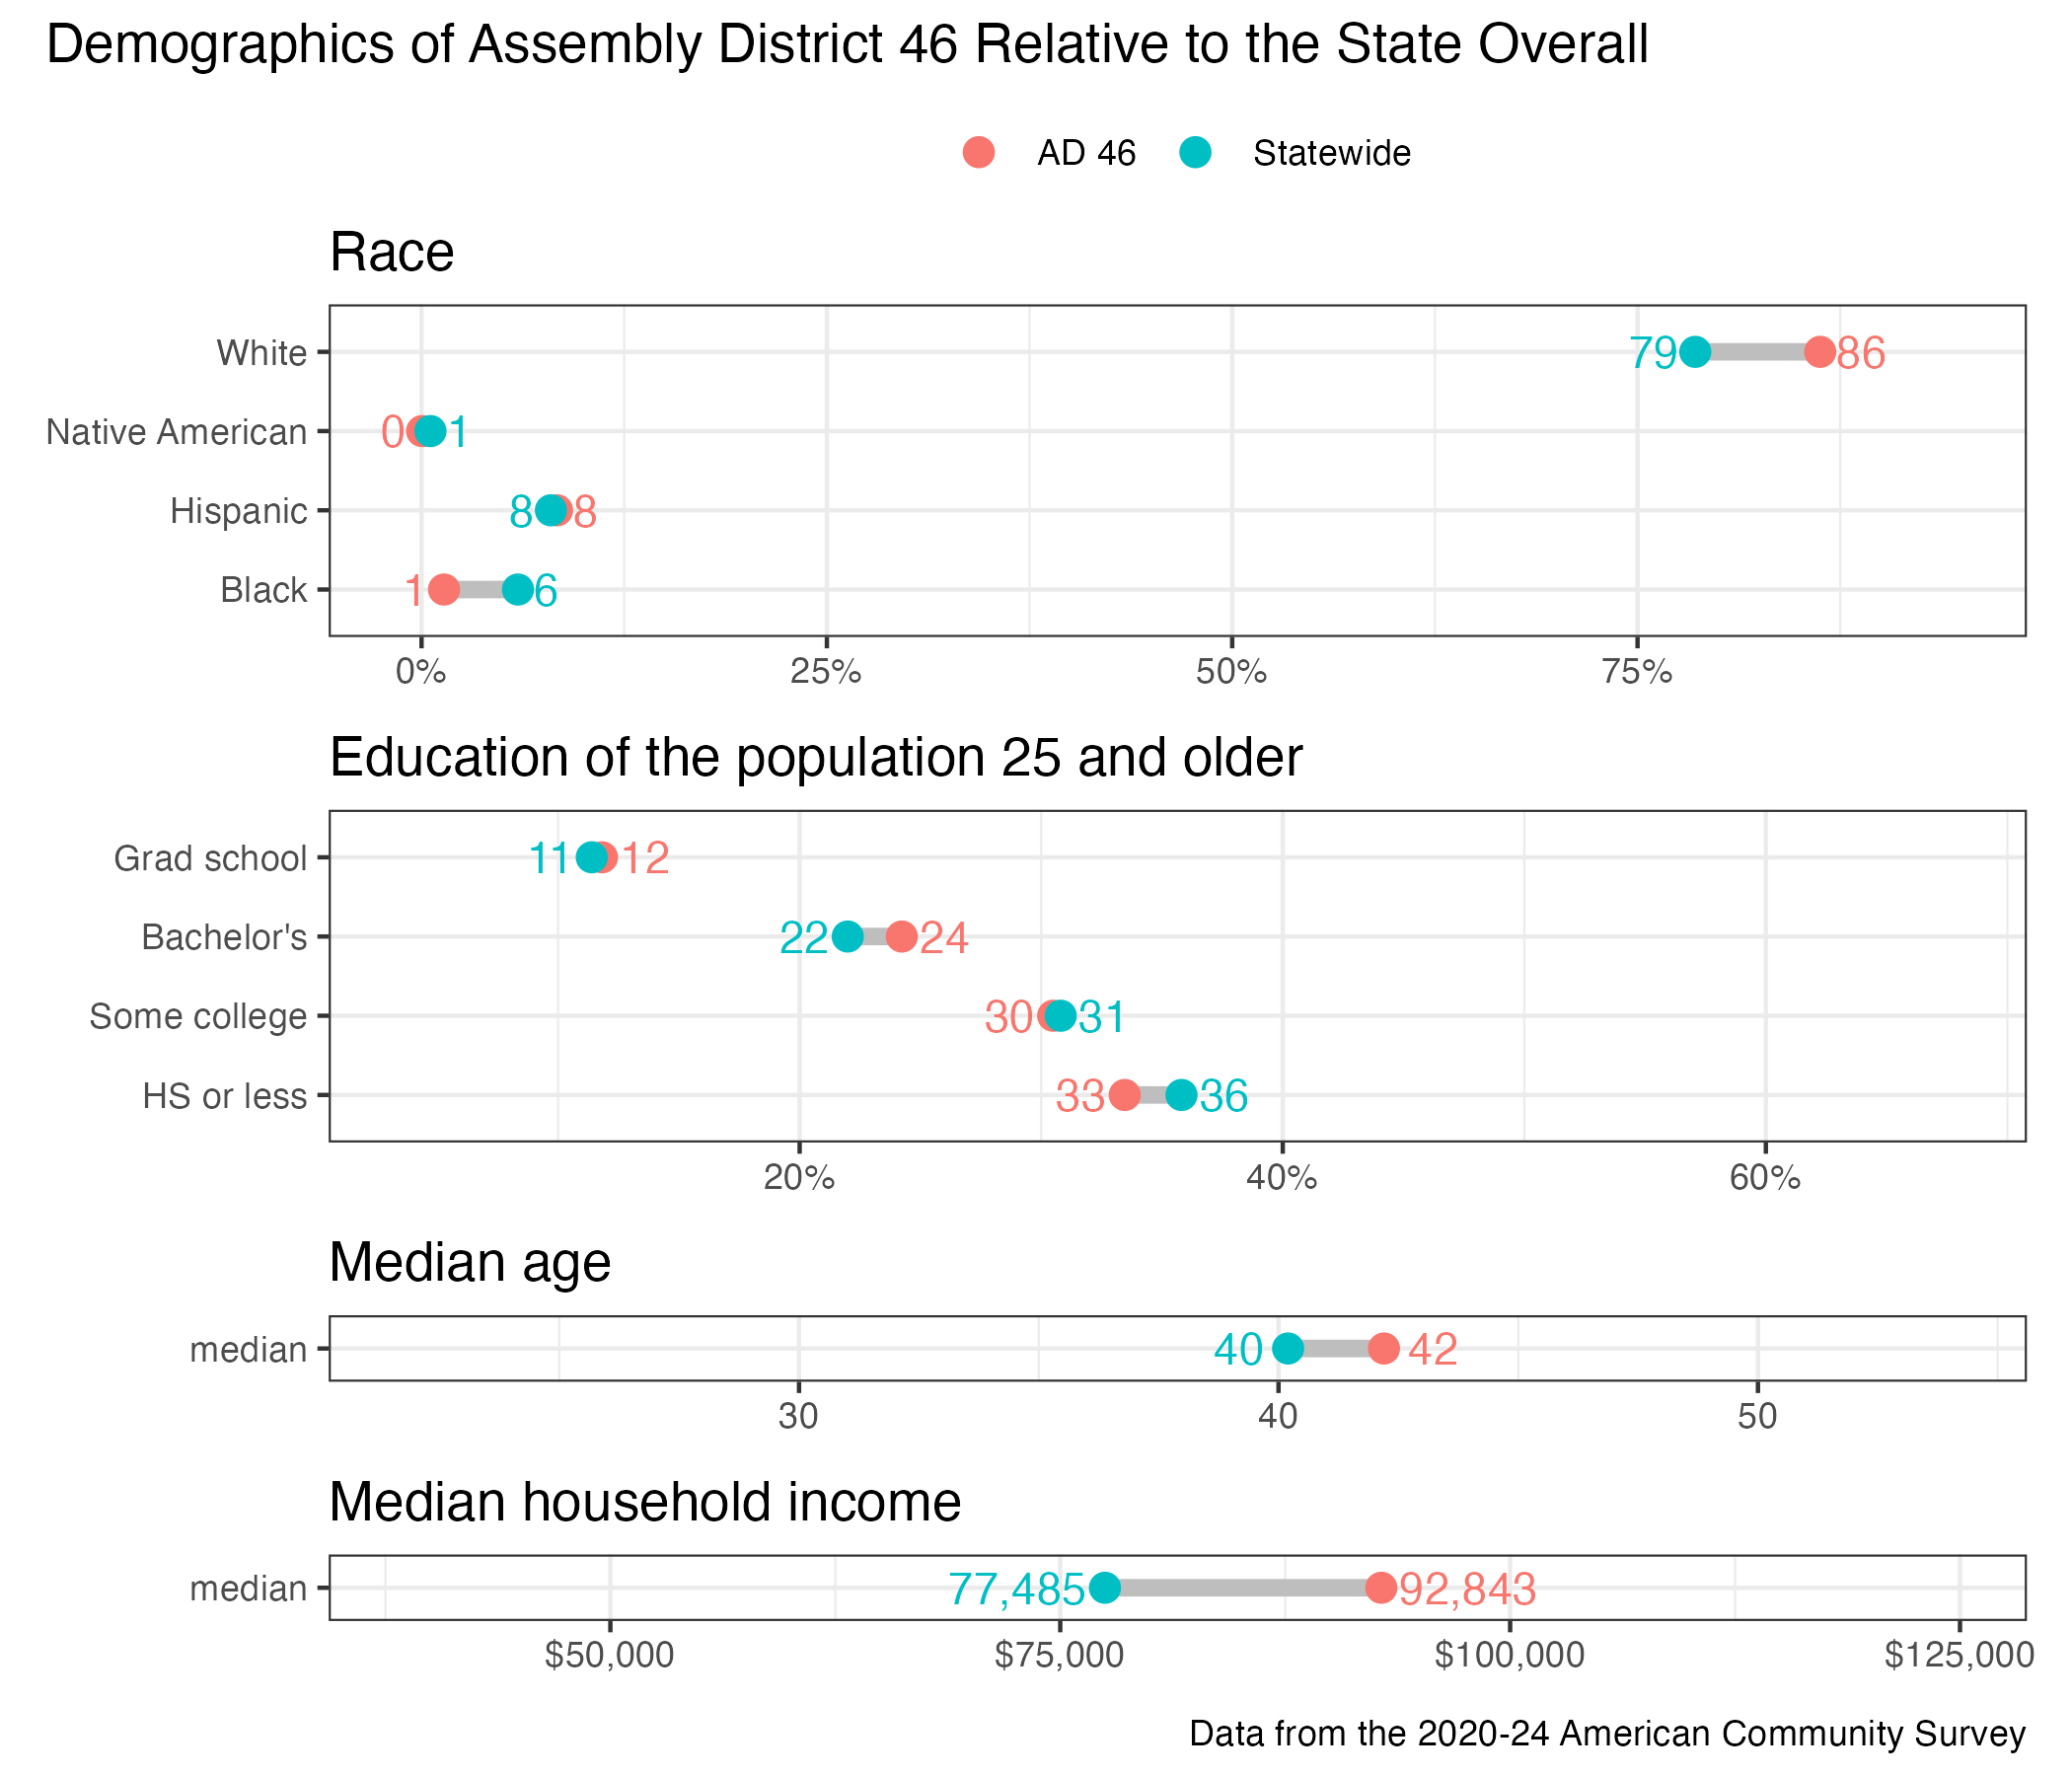
District demographics