9th Senate District
District
Candidates
| Senate District 9 Candidates on the Primary Ballot | ||
| Incumbent: Devin LeMahieu (Filed Notification of Noncandidacy) | ||
Jan 1 thru July 30
|
||
|---|---|---|
| receipts | disbursements | |
| Independent | ||
| Christian Ellis | $9,388.76 | $5,235.05 |
| Republican | ||
| Amy Binsfeld | $30,045.00 | $15,160.91 |
| Data from the 2026 July Continuing Report. Any amended reports might not yet be shown. | ||
Past election results
| Election Results in Wisconsin State Senate District 9 | ||||||
votes
|
Dem. %1 |
margin (Dem. - Rep.)
|
||||
|---|---|---|---|---|---|---|
| total | Dem. | Rep. | votes | points2 | ||
| 2016 President | 89,208 | 34,739 | 47,931 | 42.0% | −13,192 | −16.0 |
| 2016 Senator | 88,169 | 33,822 | 51,052 | 39.8% | −17,230 | −20.3 |
| 2018 Governor | 78,945 | 31,725 | 45,781 | 40.9% | −14,056 | −18.1 |
| 2018 Senator | 78,491 | 37,373 | 41,017 | 47.7% | −3,644 | −4.6 |
| 2020 President | 98,381 | 40,830 | 55,688 | 42.3% | −14,858 | −15.4 |
| 2022 Governor | 79,389 | 33,557 | 44,799 | 42.8% | −11,242 | −14.3 |
| 2022 Senator | 79,174 | 32,022 | 46,978 | 40.5% | −14,956 | −18.9 |
| 2024 President | 101,068 | 41,838 | 57,676 | 42.0% | −15,838 | −15.9 |
| 2024 Senator | 100,131 | 41,862 | 55,881 | 42.8% | −14,019 | −14.3 |
| 2024 NA | NA | NA | NA | NA | NA | NA |
| 2025 WI Sup. Ct.3 | 70,091 | 32,571 | 37,471 | 46.5% | −4,900 | −7.0 |
| 1 Share of the two-party vote. For Rep. share, subtract from 100. | ||||||
| 2 Dem % of the two-party vote minus Rep % of the two-party vote | ||||||
| 3 Formally nonpartisan candidates assigned party labels based on state endorsements | ||||||
| Election results allocated into 2024 district boundaries based on population overlap. Calculations by John Johnson (johndjohnson.info). | ||||||
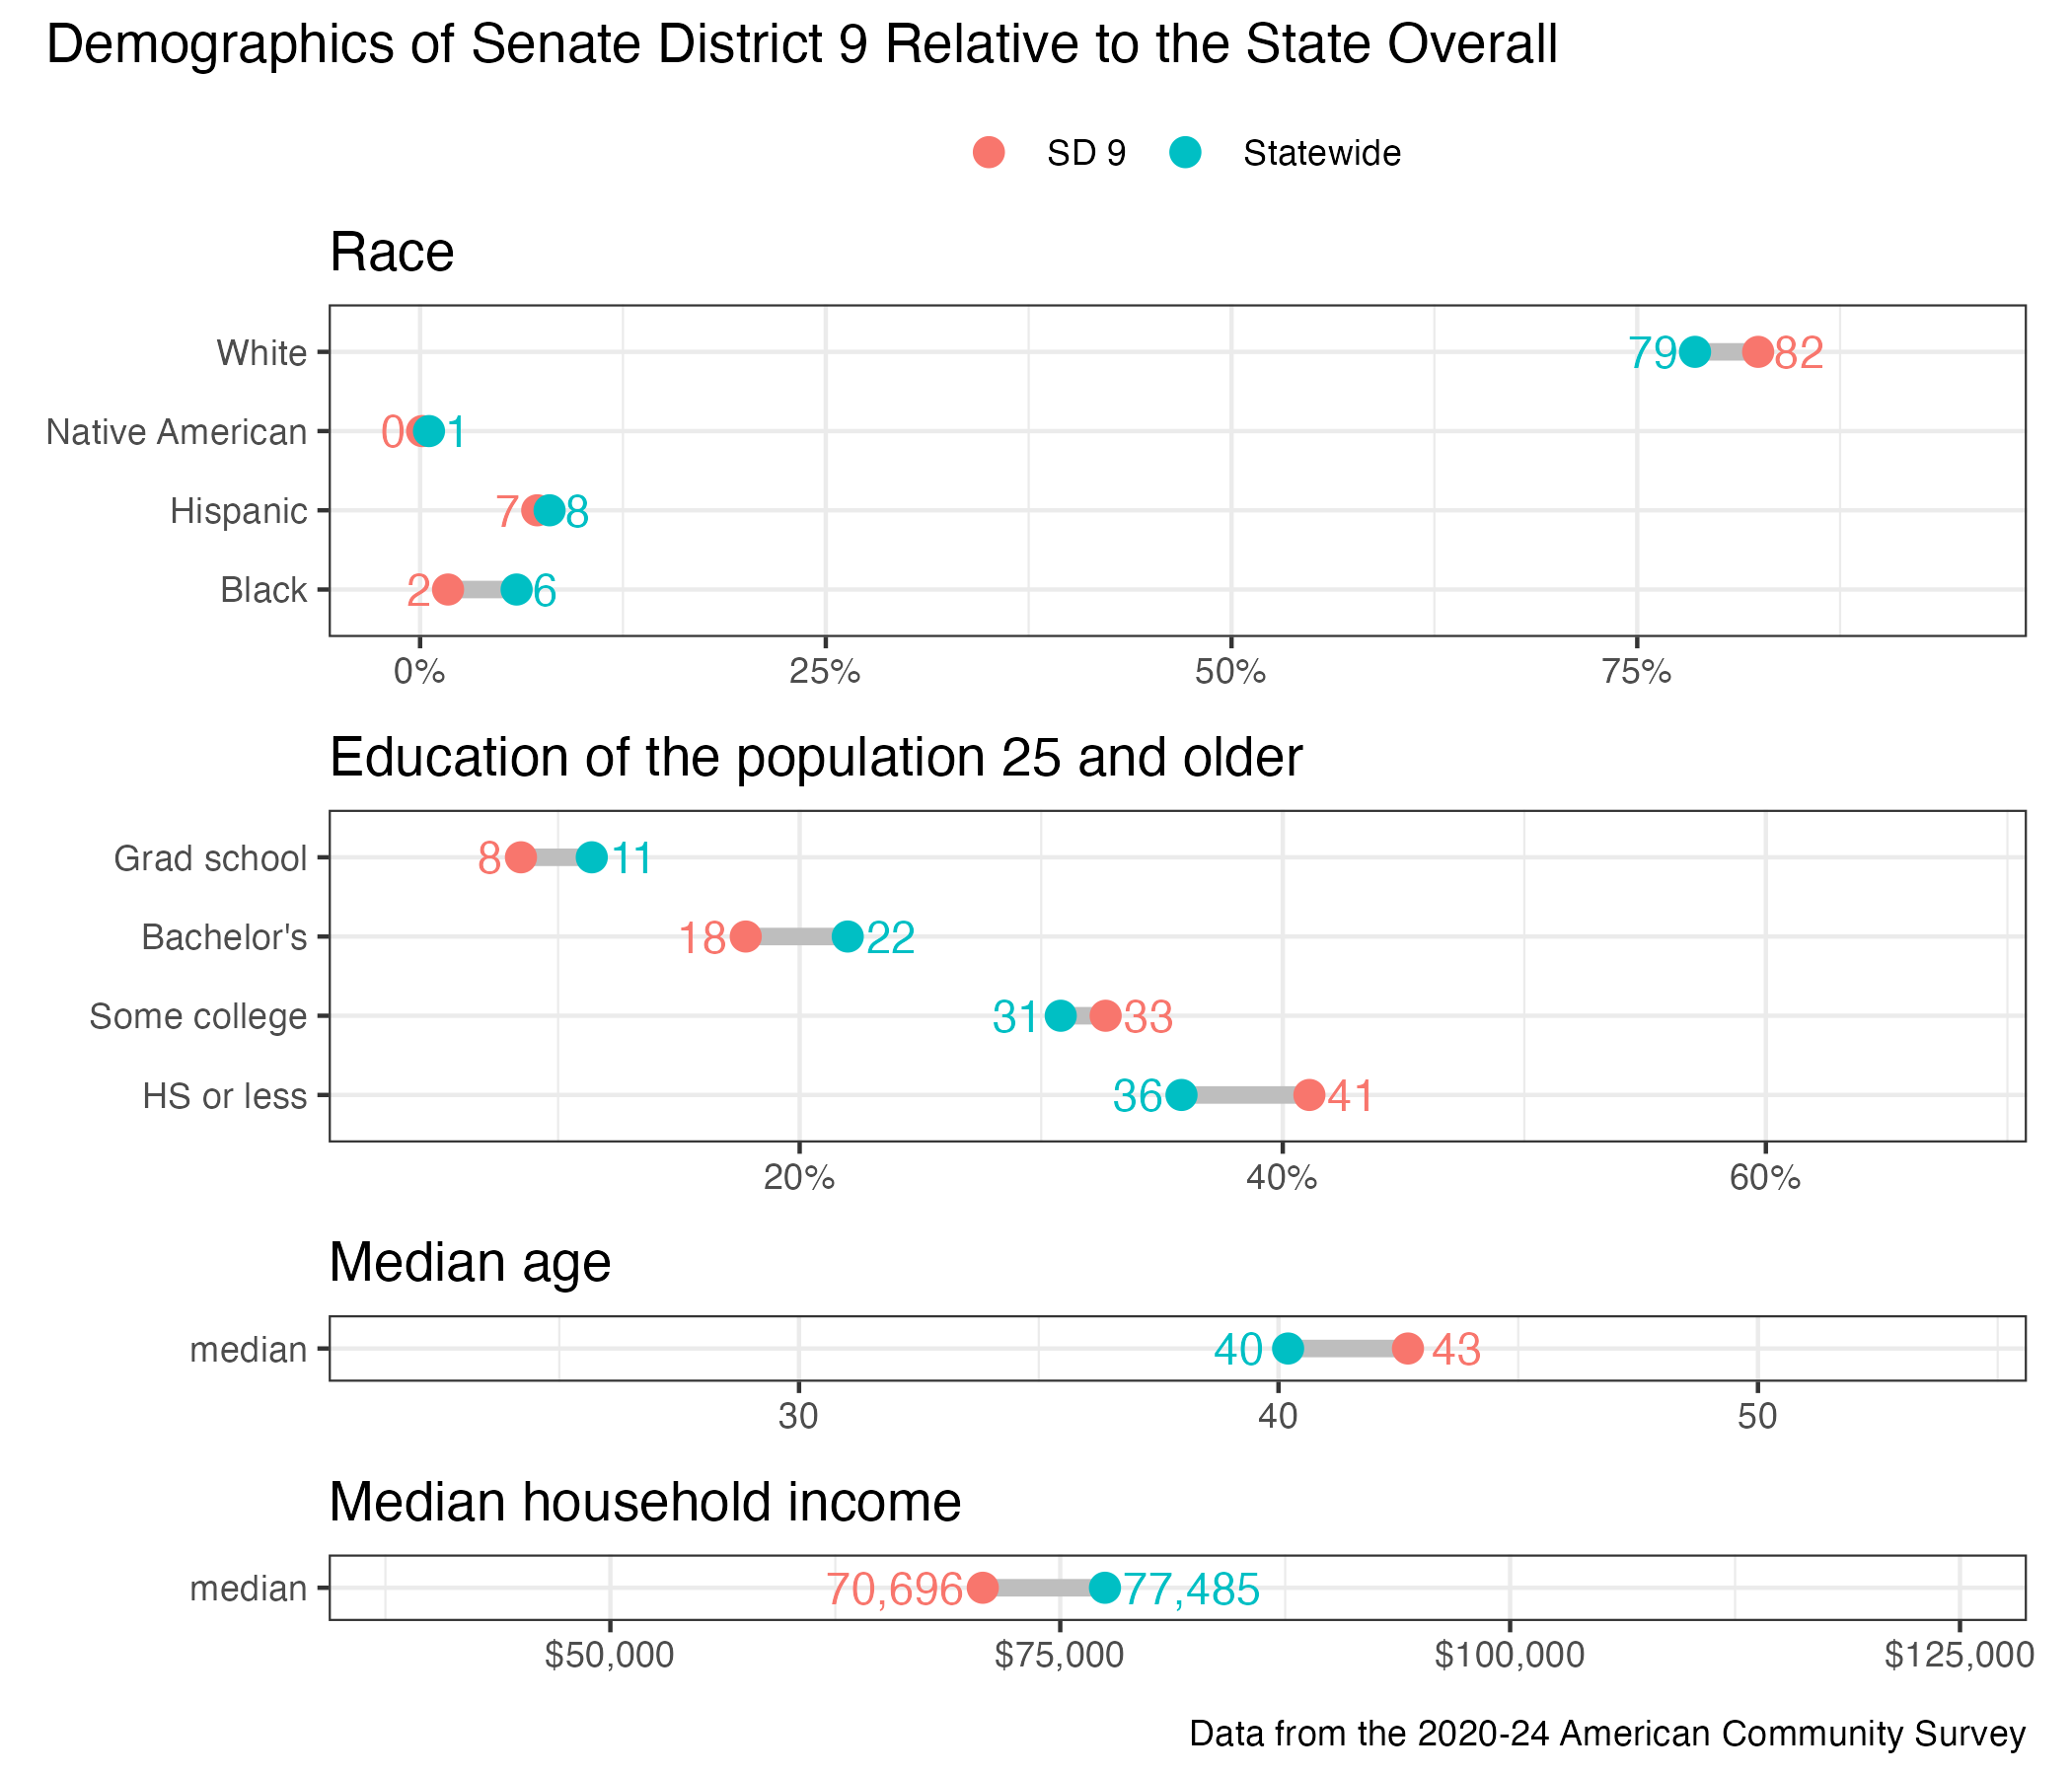
District demographics