64th Assembly District
District
Candidates
| Assembly District 64 Candidates on the Primary Ballot | ||
| Incumbent: Tip McGuire | ||
Jan 1 thru July 30
|
||
|---|---|---|
| receipts | disbursements | |
| Republican | ||
| Ed Hibsch | $50.00 | $510.99 |
| Democratic | ||
| Tip McGuire | $22,196.16 | $13,243.53 |
| Data from the 2026 July Continuing Report. Any amended reports might not yet be shown. | ||
Past election results
| Election Results in Wisconsin State Assembly District 64 | ||||||
votes
|
Dem. %1 |
margin (Dem. - Rep.)
|
||||
|---|---|---|---|---|---|---|
| total | Dem. | Rep. | votes | points2 | ||
| 2016 President | 25,511 | 13,664 | 10,353 | 56.9% | +3,311 | +13.8 |
| 2016 Senator | 25,300 | 13,509 | 10,939 | 55.3% | +2,570 | +10.5 |
| 2018 Governor | 22,708 | 13,077 | 8,975 | 59.3% | +4,102 | +18.6 |
| 2018 Senator | 22,564 | 14,213 | 8,306 | 63.1% | +5,907 | +26.2 |
| 2020 President | 29,029 | 15,699 | 12,766 | 55.2% | +2,933 | +10.3 |
| 2022 Governor | 21,194 | 11,808 | 9,139 | 56.4% | +2,669 | +12.7 |
| 2022 Senator | 21,163 | 11,591 | 9,527 | 54.9% | +2,064 | +9.8 |
| 2024 President | 29,725 | 15,562 | 13,679 | 53.2% | +1,883 | +6.4 |
| 2024 Senator | 29,354 | 15,738 | 12,800 | 55.1% | +2,938 | +10.3 |
| 2024 WI Assembly | 28,449 | 15,816 | 12,576 | 55.7% | +3,240 | +11.4 |
| 2025 WI Sup. Ct.3 | 18,306 | 10,922 | 7,366 | 59.7% | +3,556 | +19.4 |
| 1 Share of the two-party vote. For Rep. share, subtract from 100. | ||||||
| 2 Dem % of the two-party vote minus Rep % of the two-party vote | ||||||
| 3 Formally nonpartisan candidates assigned party labels based on state endorsements | ||||||
| Election results allocated into 2024 district boundaries based on population overlap. Calculations by John Johnson (johndjohnson.info). | ||||||
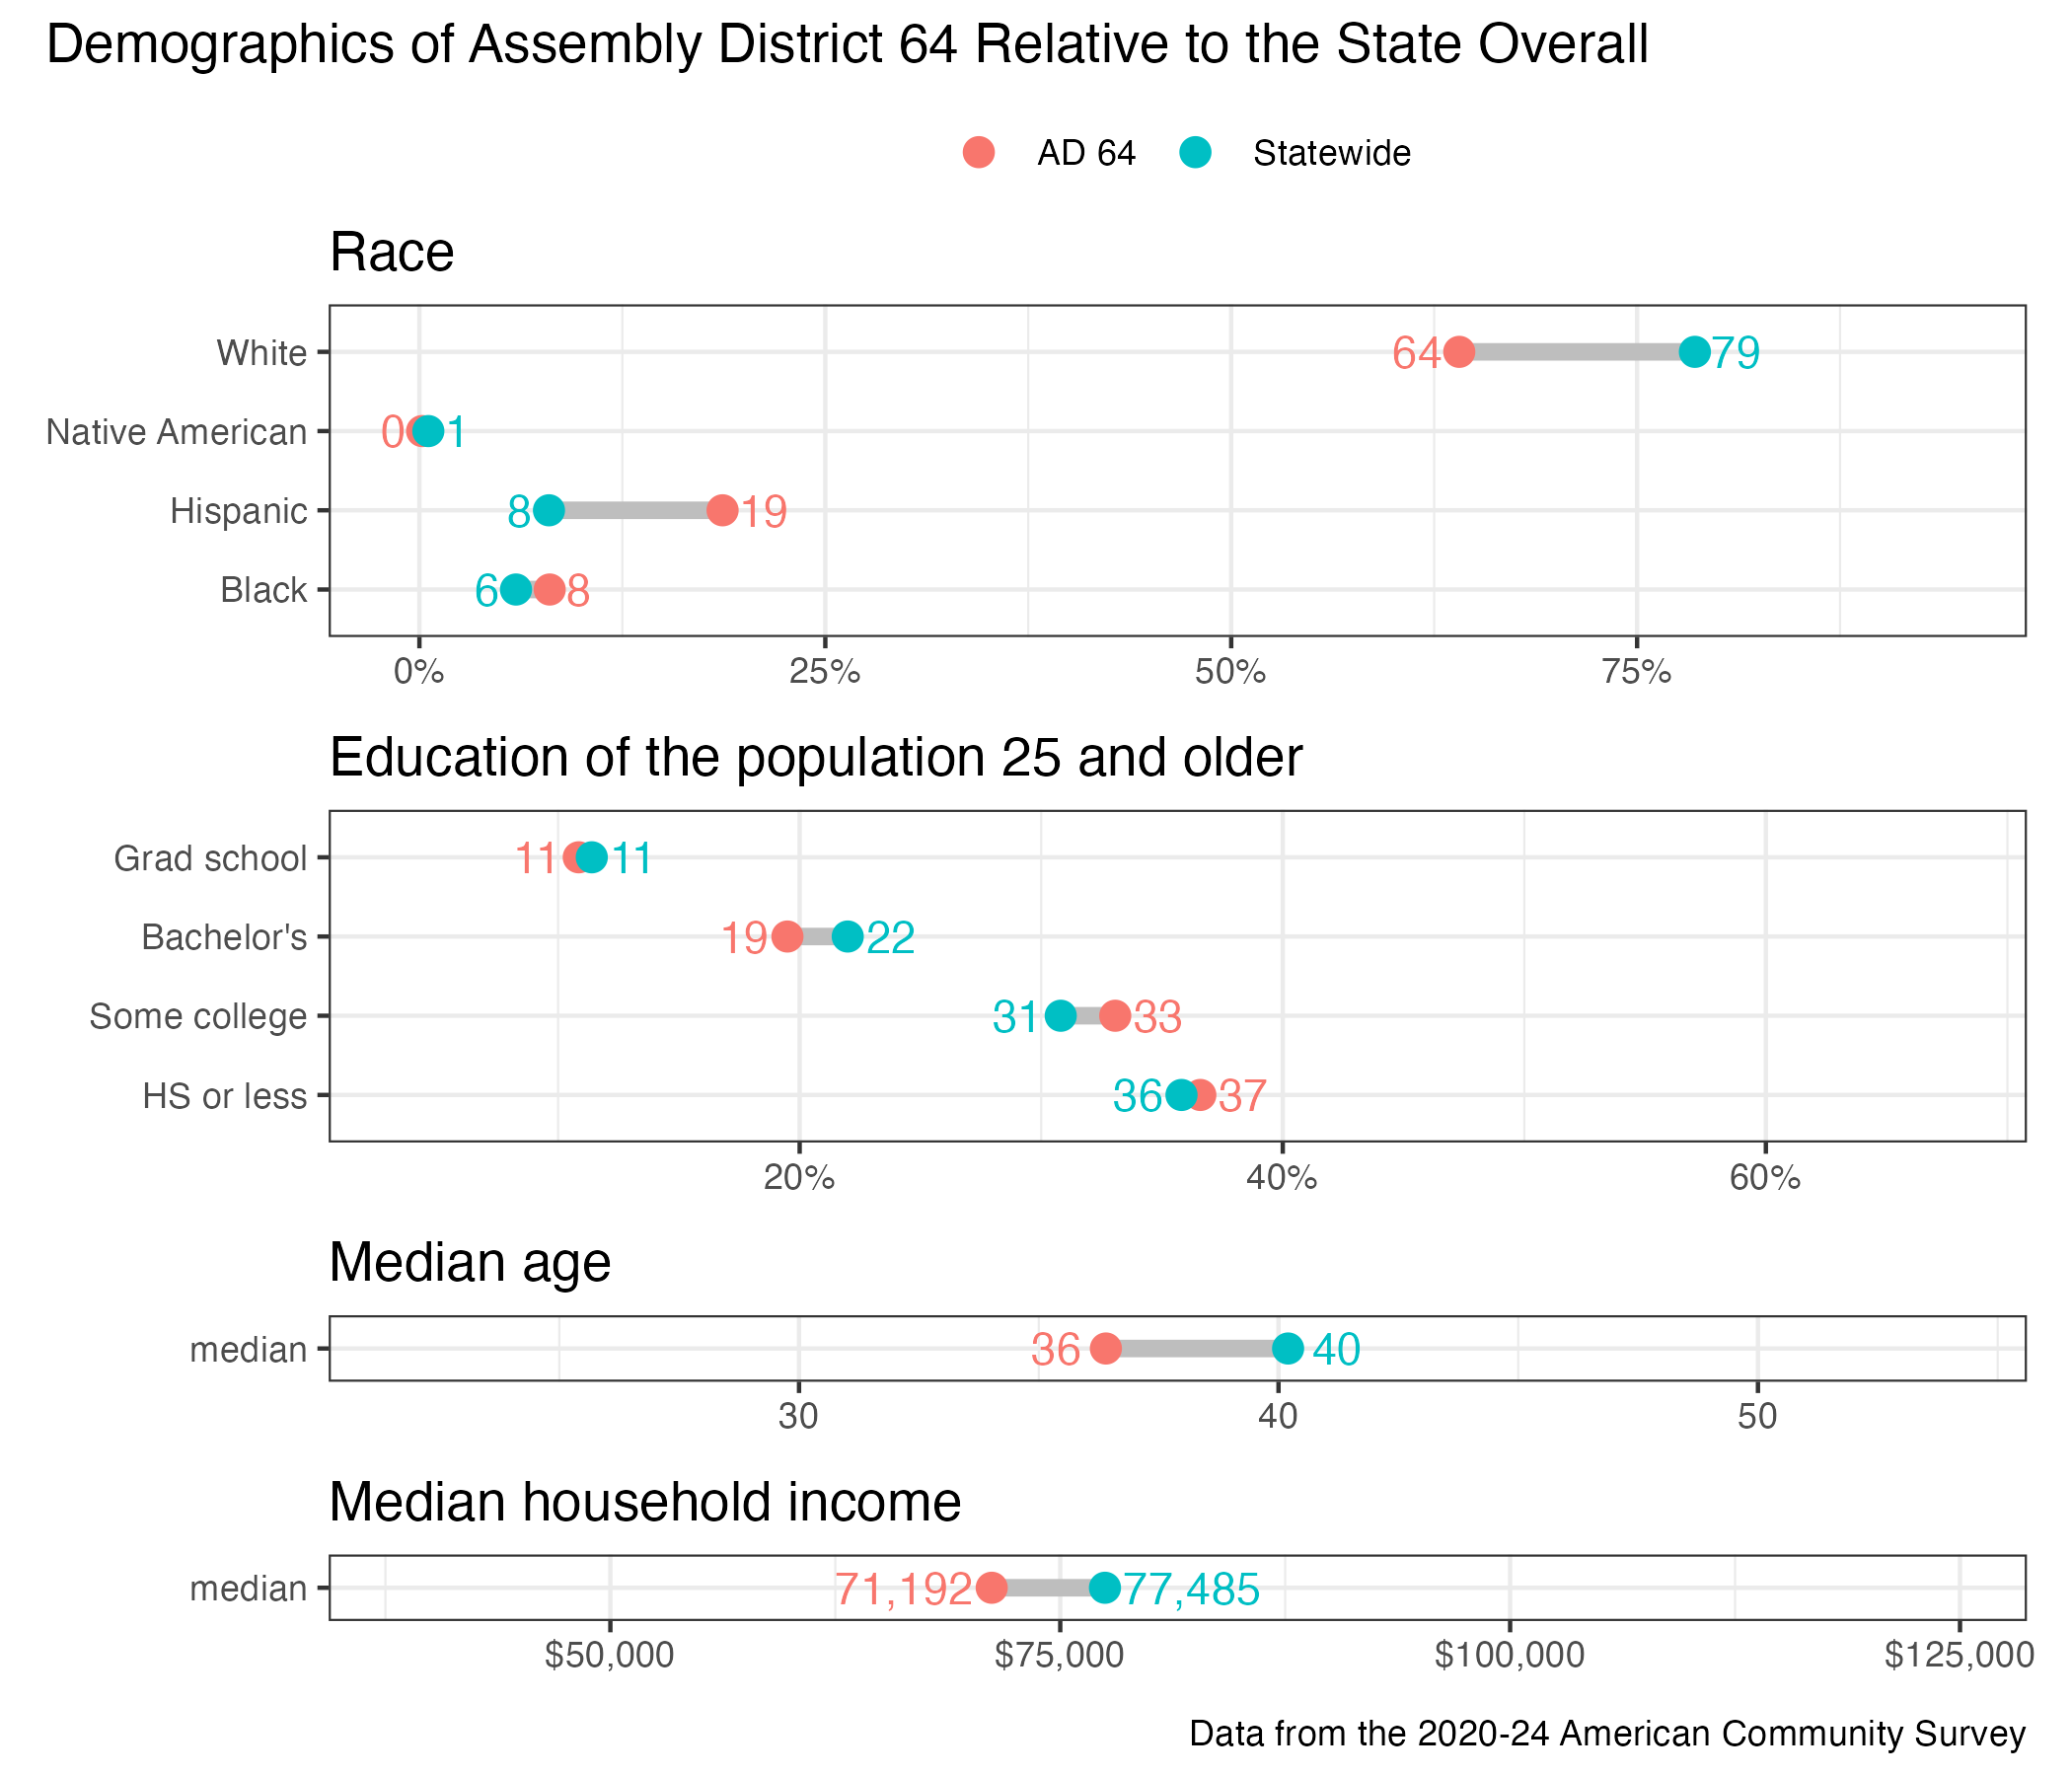
District demographics