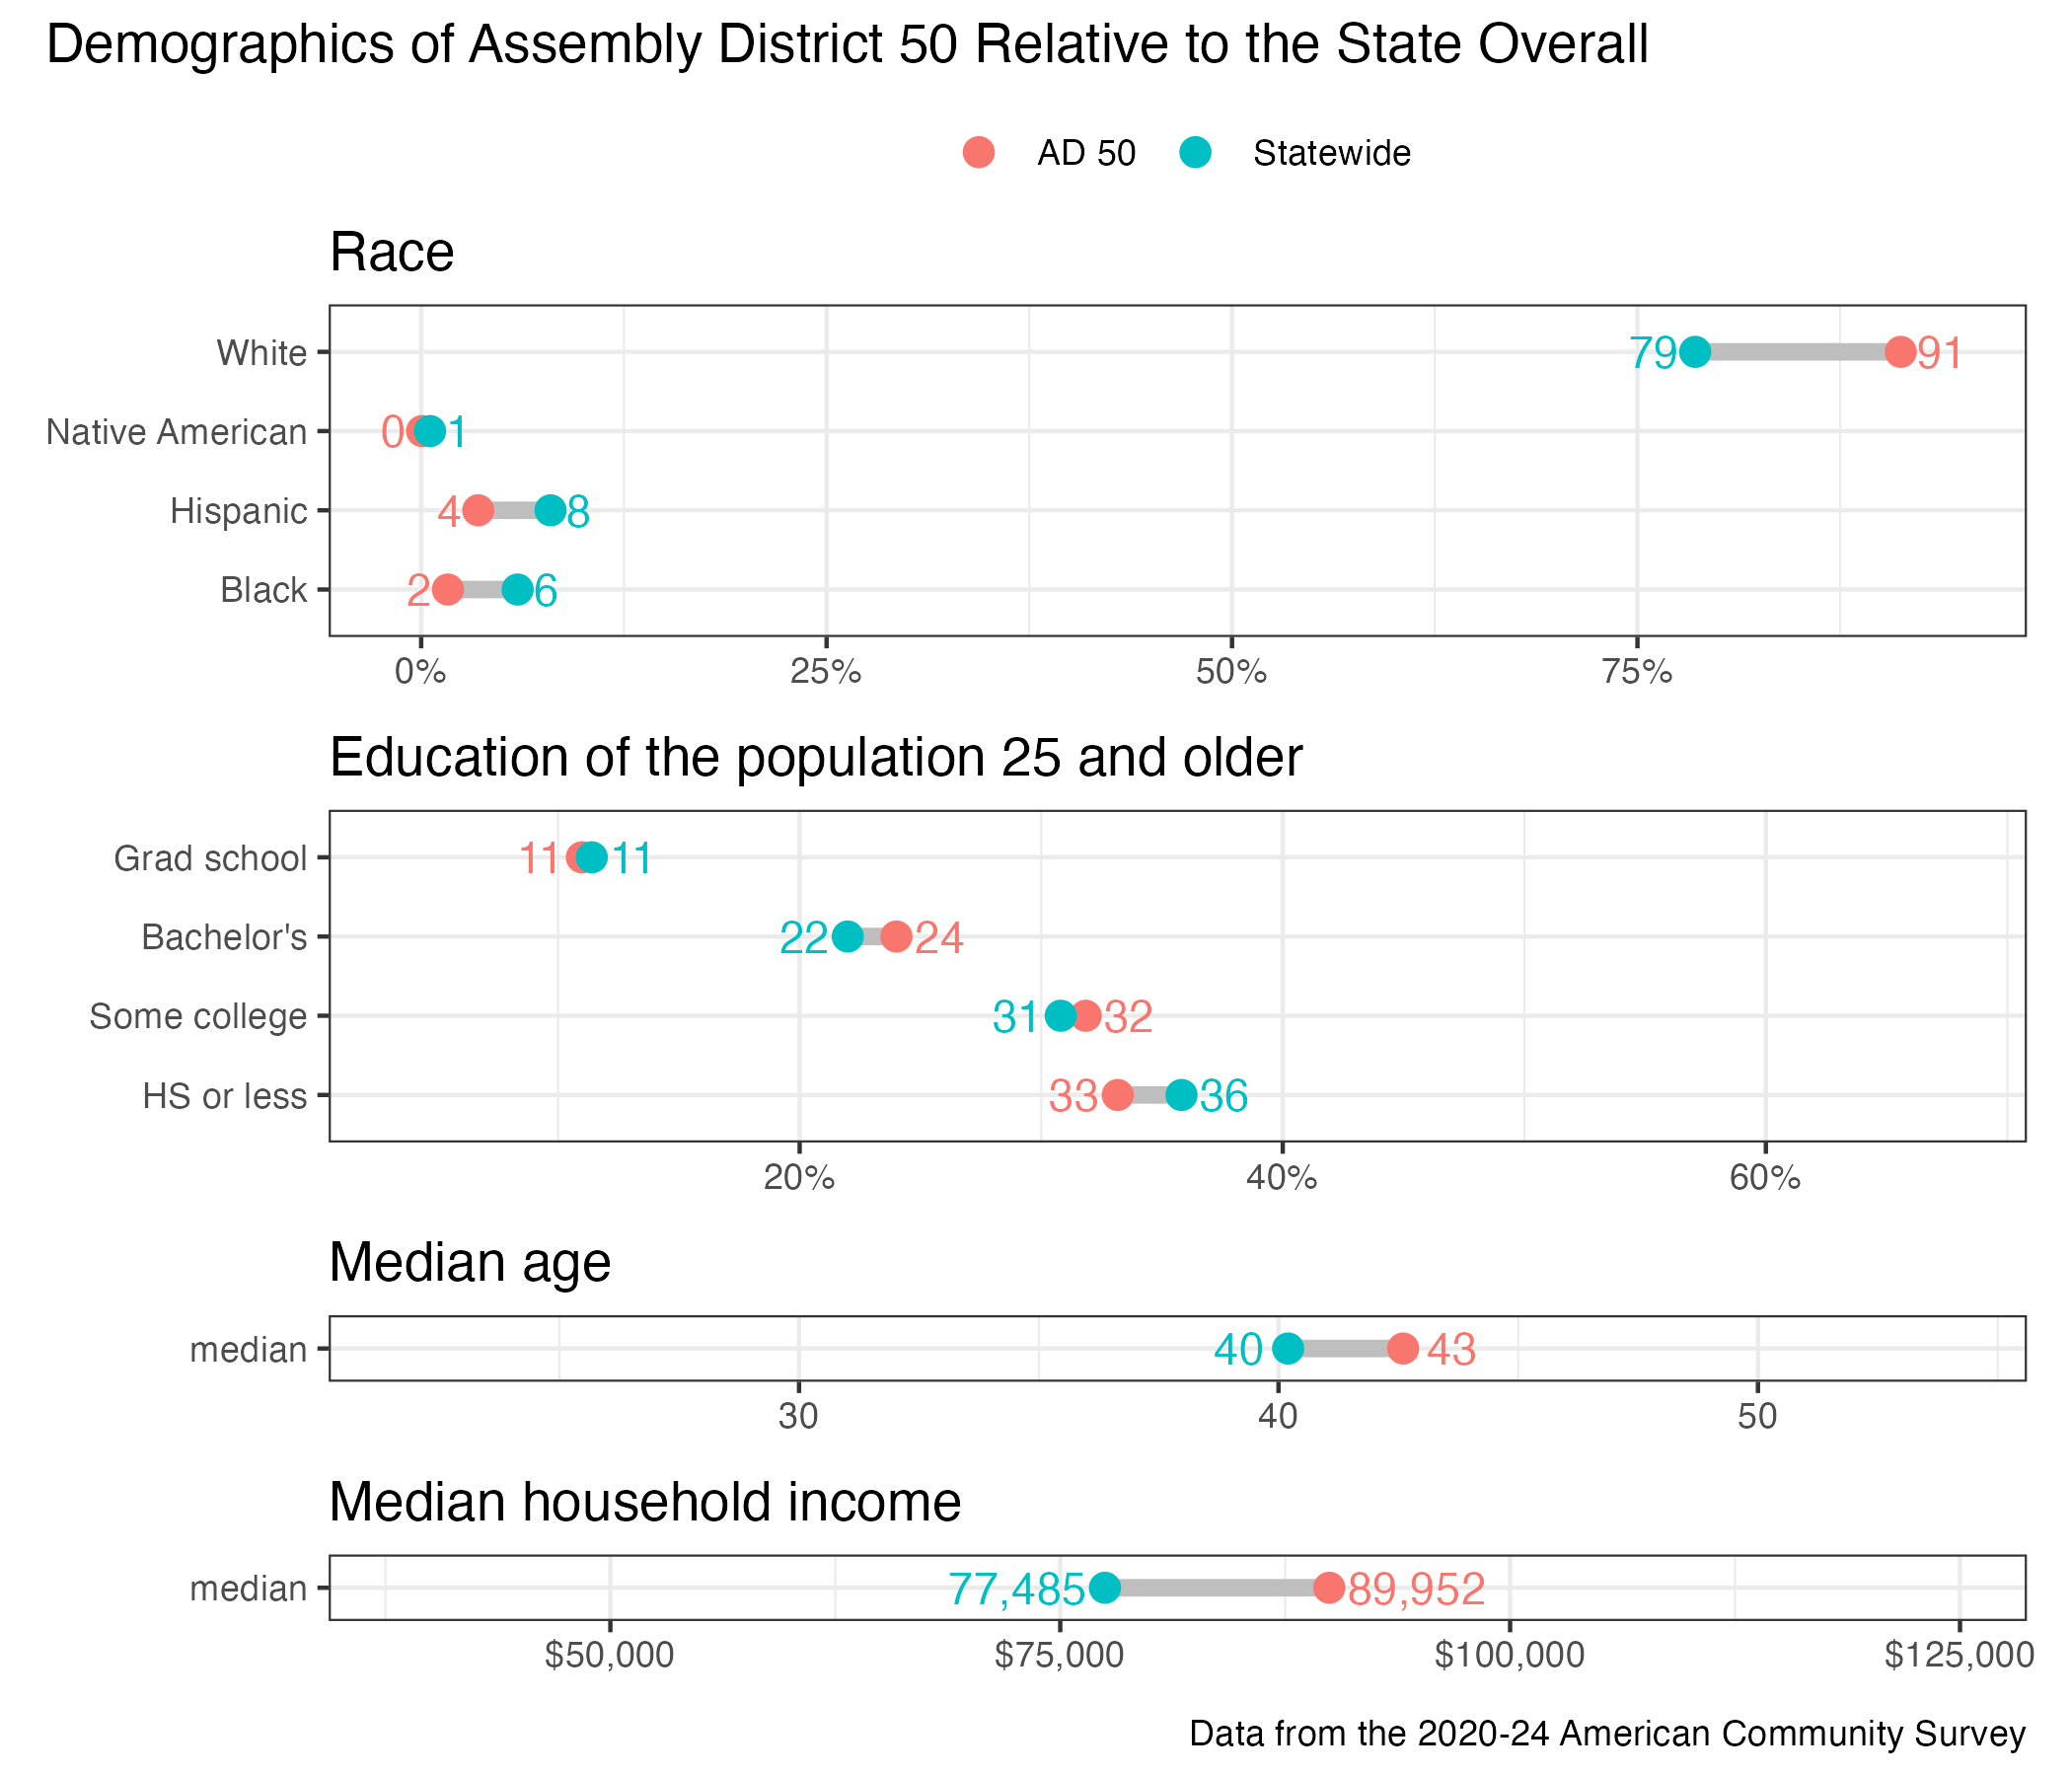
50th Assembly District
District
Candidates
| Assembly District 50 Candidates on the Primary Ballot | ||
| Incumbent: Jenna Jacobson | ||
Jan 1 thru July 30
|
||
|---|---|---|
| receipts | disbursements | |
| Republican | ||
| Jon Aleckson | $19,135.42 | $11,698.82 |
| Democratic | ||
| Bill Oemichen | $12,525.00 | $6,246.44 |
| Josh Mittness | $11,252.37 | $5,288.50 |
| Bryna Caves | $100.00 | $100.00 |
| Data from the 2026 July Continuing Report. Any amended reports might not yet be shown. | ||
Past election results
| Election Results in Wisconsin State Assembly District 50 | ||||||
votes
|
Dem. %1 |
margin (Dem. - Rep.)
|
||||
|---|---|---|---|---|---|---|
| total | Dem. | Rep. | votes | points2 | ||
| 2016 President | 31,544 | 16,933 | 12,632 | 57.3% | +4,301 | +14.5 |
| 2016 Senator | 31,365 | 18,315 | 12,287 | 59.8% | +6,028 | +19.7 |
| 2018 Governor | 29,240 | 17,417 | 11,214 | 60.8% | +6,203 | +21.7 |
| 2018 Senator | 29,145 | 18,699 | 10,425 | 64.2% | +8,274 | +28.4 |
| 2020 President | 35,997 | 20,573 | 14,767 | 58.2% | +5,806 | +16.4 |
| 2022 Governor | 30,432 | 18,558 | 11,493 | 61.8% | +7,065 | +23.5 |
| 2022 Senator | 30,337 | 17,715 | 12,549 | 58.5% | +5,166 | +17.1 |
| 2024 President | 37,538 | 21,164 | 15,792 | 57.3% | +5,372 | +14.5 |
| 2024 Senator | 37,343 | 21,365 | 15,290 | 58.3% | +6,075 | +16.6 |
| 2024 WI Assembly | 36,286 | 20,418 | 15,841 | 56.3% | +4,577 | +12.6 |
| 2025 WI Sup. Ct.3 | 28,372 | 18,315 | 10,030 | 64.6% | +8,285 | +29.2 |
| 1 Share of the two-party vote. For Rep. share, subtract from 100. | ||||||
| 2 Dem % of the two-party vote minus Rep % of the two-party vote | ||||||
| 3 Formally nonpartisan candidates assigned party labels based on state endorsements | ||||||
| Election results allocated into 2024 district boundaries based on population overlap. Calculations by John Johnson (johndjohnson.info). | ||||||
District demographics