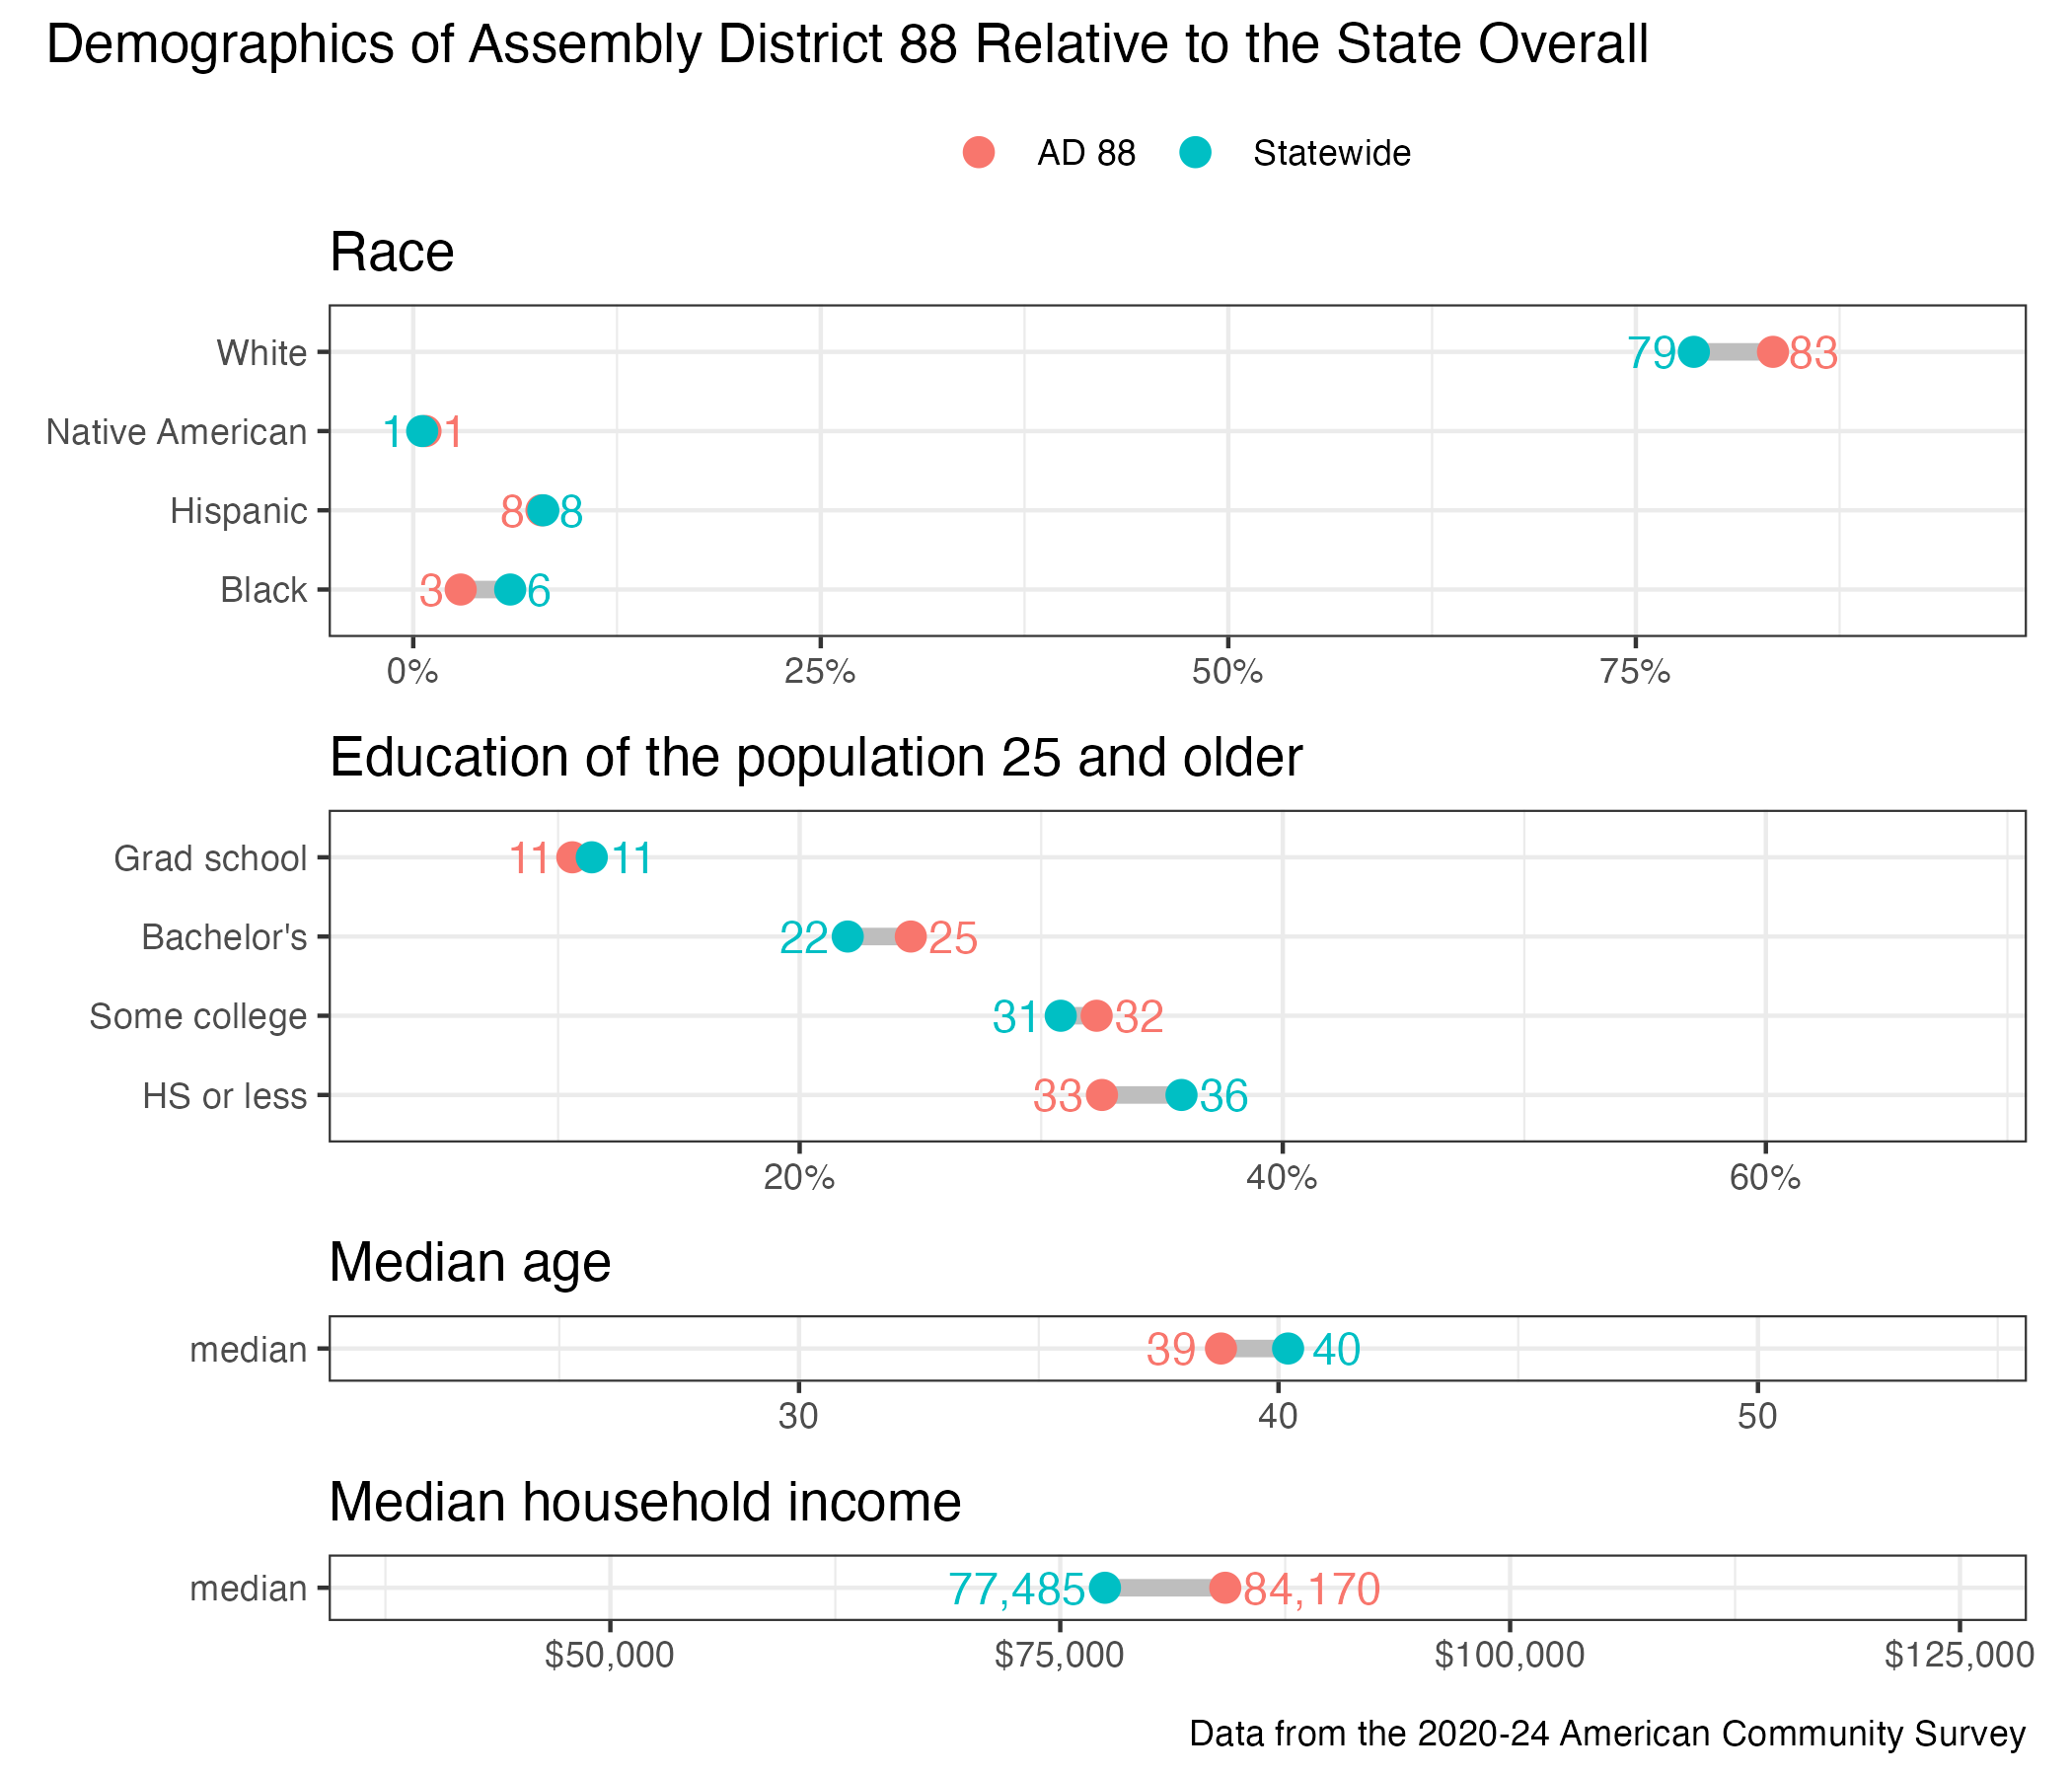
88th Assembly District
District
Candidates
| Assembly District 88 Candidates on the Primary Ballot | ||
| Incumbent: Benjamin Franklin | ||
Jan 1 thru July 30
|
||
|---|---|---|
| receipts | disbursements | |
| Republican | ||
| Ben Franklin | $21,132.76 | $2,323.92 |
| Democratic | ||
| Brandy Tollefson | $64,436.90 | $10,395.88 |
| Data from the 2026 July Continuing Report. Any amended reports might not yet be shown. | ||
Past election results
| Election Results in Wisconsin State Assembly District 88 | ||||||
votes
|
Dem. %1 |
margin (Dem. - Rep.)
|
||||
|---|---|---|---|---|---|---|
| total | Dem. | Rep. | votes | points2 | ||
| 2016 President | 31,302 | 13,597 | 15,602 | 46.6% | −2,005 | −6.9 |
| 2016 Senator | 31,035 | 12,794 | 17,216 | 42.6% | −4,422 | −14.7 |
| 2018 Governor | 28,076 | 13,069 | 14,441 | 47.5% | −1,372 | −5.0 |
| 2018 Senator | 27,933 | 14,811 | 13,077 | 53.1% | +1,734 | +6.2 |
| 2020 President | 34,083 | 16,596 | 16,835 | 49.6% | −239 | −0.7 |
| 2022 Governor | 26,848 | 13,768 | 12,800 | 51.8% | +968 | +3.6 |
| 2022 Senator | 26,783 | 13,128 | 13,595 | 49.1% | −467 | −1.7 |
| 2024 President | 34,844 | 17,215 | 17,094 | 50.2% | +121 | +0.4 |
| 2024 Senator | 34,497 | 17,107 | 16,677 | 50.6% | +430 | +1.3 |
| 2024 WI Assembly | 33,818 | 16,788 | 17,008 | 49.7% | −220 | −0.7 |
| 2025 WI Sup. Ct.3 | 23,667 | 13,164 | 10,492 | 55.6% | +2,672 | +11.3 |
| 1 Share of the two-party vote. For Rep. share, subtract from 100. | ||||||
| 2 Dem % of the two-party vote minus Rep % of the two-party vote | ||||||
| 3 Formally nonpartisan candidates assigned party labels based on state endorsements | ||||||
| Election results allocated into 2024 district boundaries based on population overlap. Calculations by John Johnson (johndjohnson.info). | ||||||
District demographics