62nd Assembly District
District
Candidates
| Assembly District 62 Candidates on the Primary Ballot | ||
| Incumbent: Angelina M. Cruz | ||
Jan 1 thru July 30
|
||
|---|---|---|
| receipts | disbursements | |
| Republican | ||
| Mike Bellagio | $0.00 | $0.00 |
| Democratic | ||
| Angelina M. Cruz | $8,961.12 | $800.00 |
| Data from the 2026 July Continuing Report. Any amended reports might not yet be shown. | ||
Past election results
| Election Results in Wisconsin State Assembly District 62 | ||||||
votes
|
Dem. %1 |
margin (Dem. - Rep.)
|
||||
|---|---|---|---|---|---|---|
| total | Dem. | Rep. | votes | points2 | ||
| 2016 President | 24,889 | 14,647 | 8,883 | 62.2% | +5,764 | +24.5 |
| 2016 Senator | 24,632 | 14,178 | 9,736 | 59.3% | +4,442 | +18.6 |
| 2018 Governor | 22,715 | 13,550 | 8,544 | 61.3% | +5,006 | +22.7 |
| 2018 Senator | 22,638 | 14,835 | 7,764 | 65.6% | +7,071 | +31.3 |
| 2020 President | 27,038 | 16,620 | 9,916 | 62.6% | +6,704 | +25.3 |
| 2022 Governor | 19,377 | 11,847 | 7,284 | 61.9% | +4,563 | +23.9 |
| 2022 Senator | 19,453 | 11,765 | 7,637 | 60.6% | +4,128 | +21.3 |
| 2024 President | 26,698 | 16,093 | 10,197 | 61.2% | +5,896 | +22.4 |
| 2024 Senator | 26,434 | 15,910 | 9,808 | 61.9% | +6,102 | +23.7 |
| 2024 WI Assembly | 20,013 | 19,060 | 0 | 100.0% | +19,060 | +100.0 |
| 2025 WI Sup. Ct.3 | 17,443 | 11,258 | 6,166 | 64.6% | +5,092 | +29.2 |
| 1 Share of the two-party vote. For Rep. share, subtract from 100. | ||||||
| 2 Dem % of the two-party vote minus Rep % of the two-party vote | ||||||
| 3 Formally nonpartisan candidates assigned party labels based on state endorsements | ||||||
| Election results allocated into 2024 district boundaries based on population overlap. Calculations by John Johnson (johndjohnson.info). | ||||||
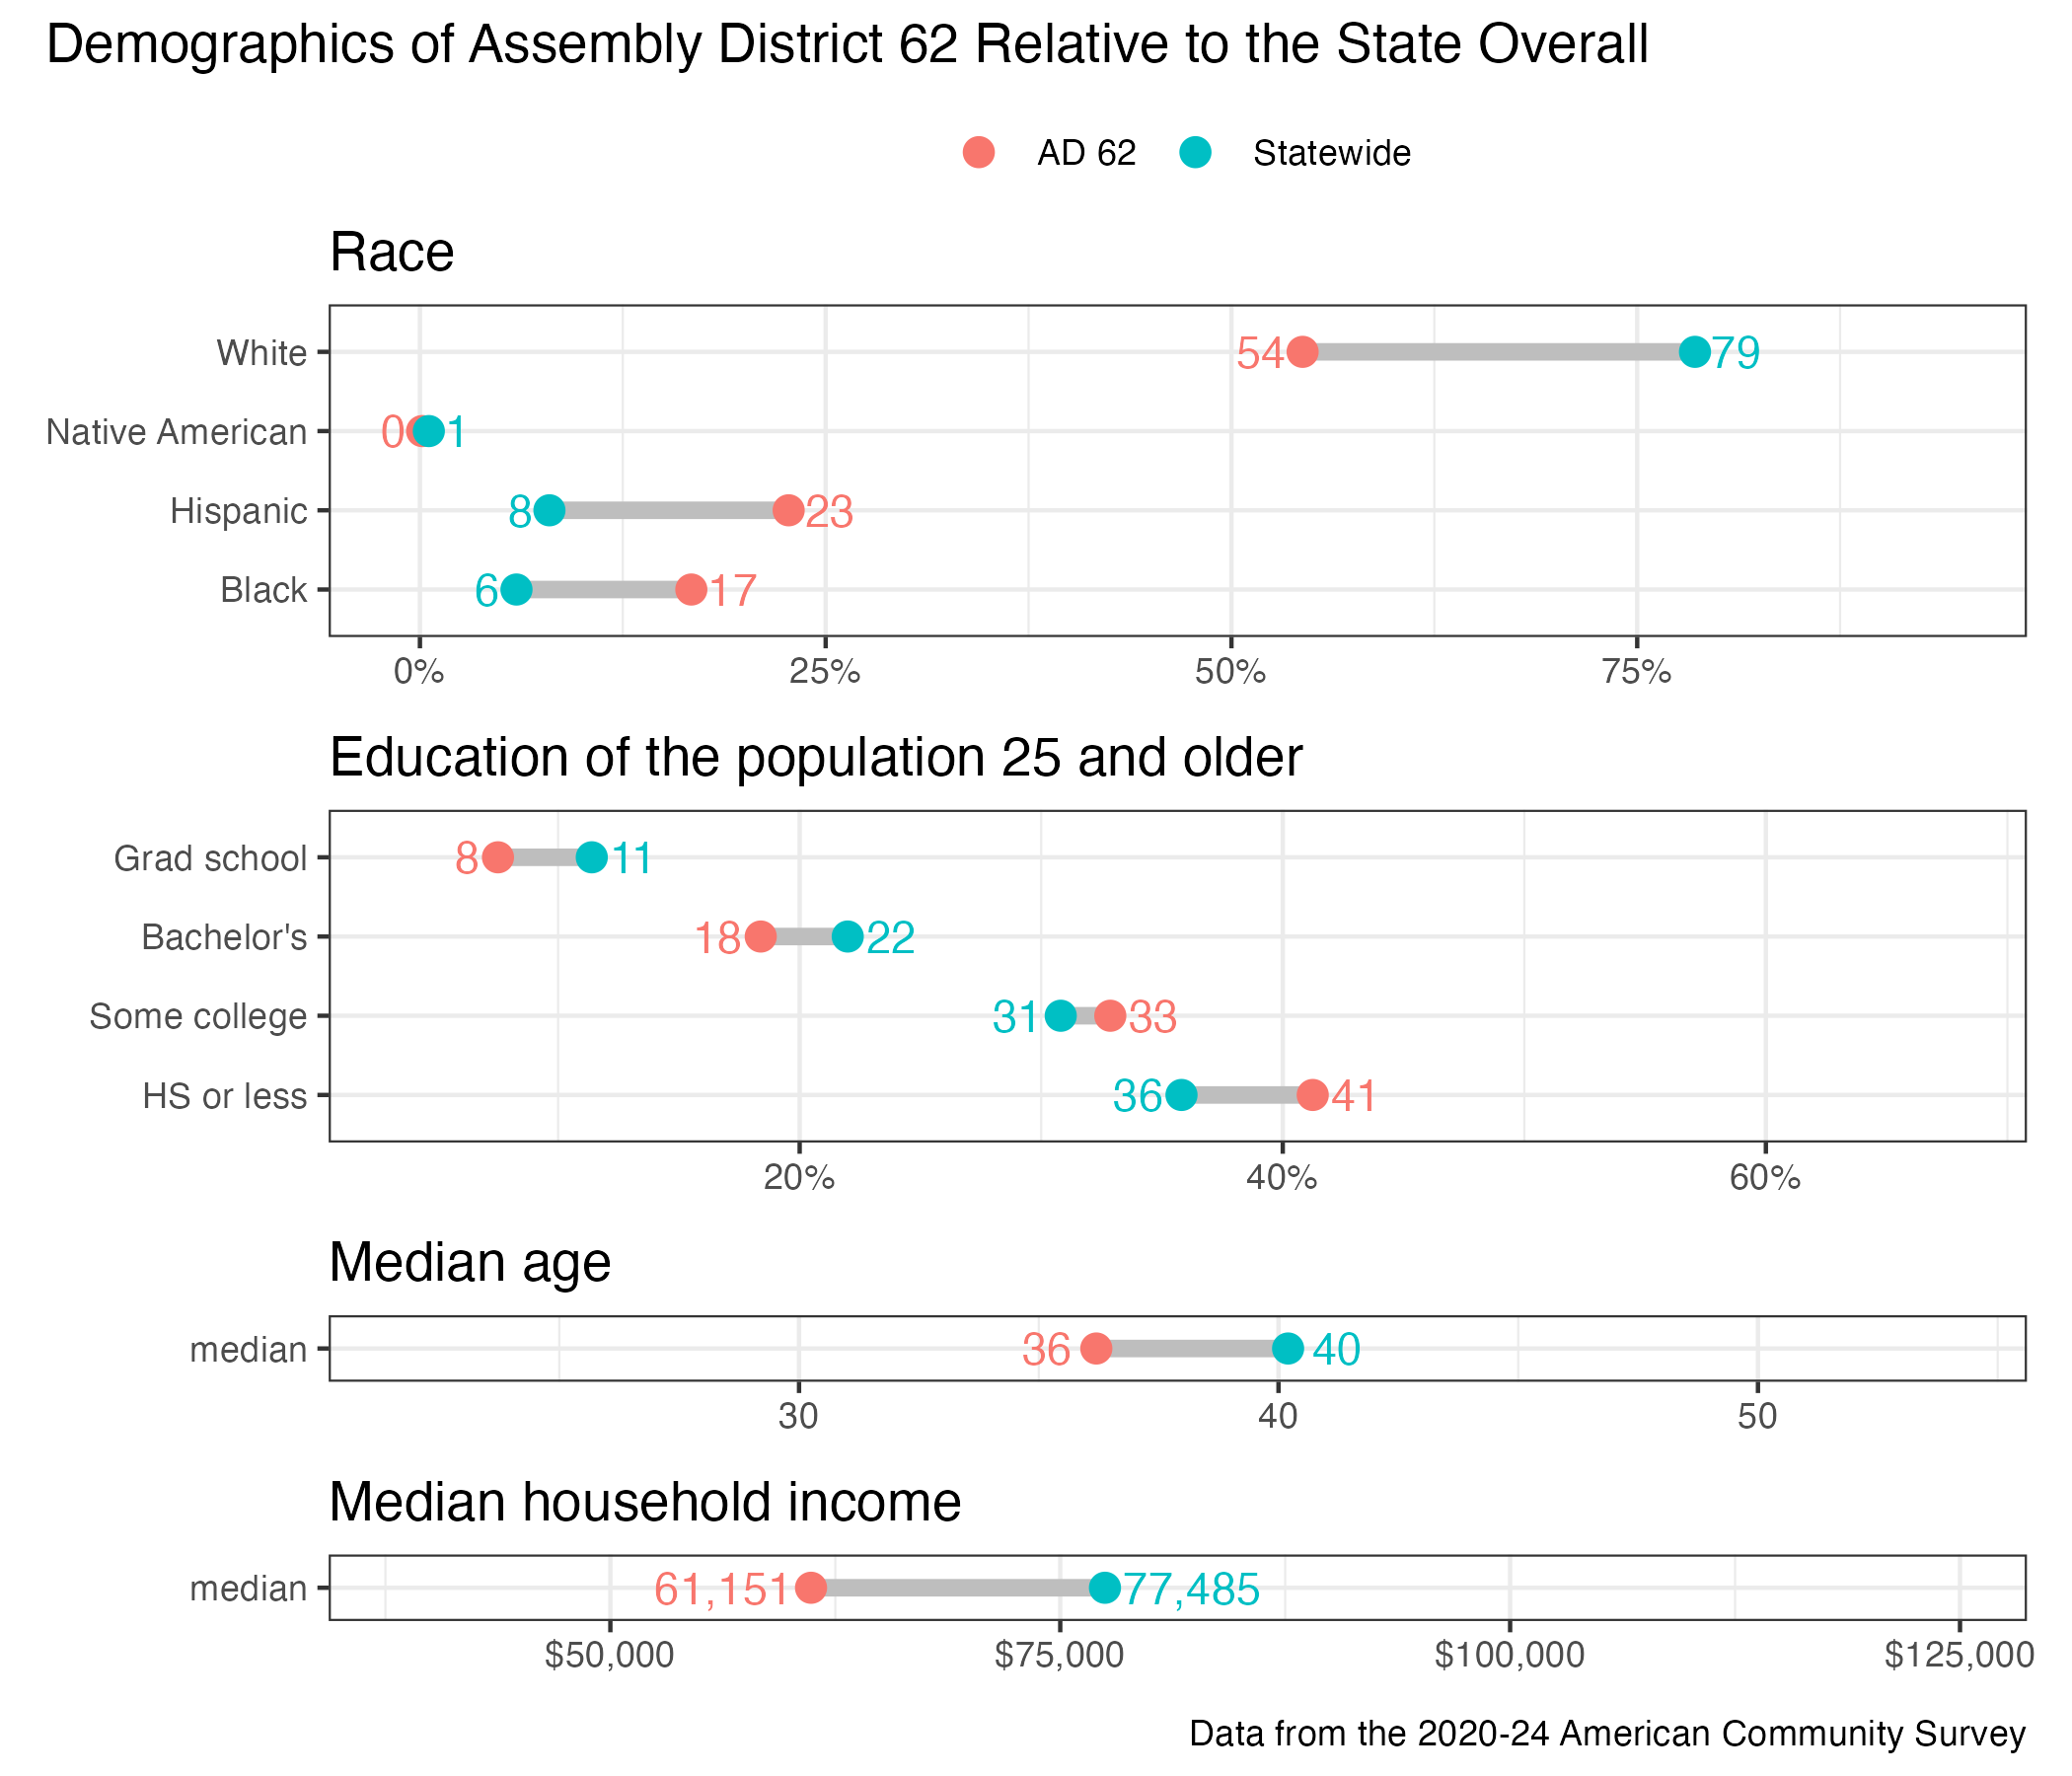
District demographics