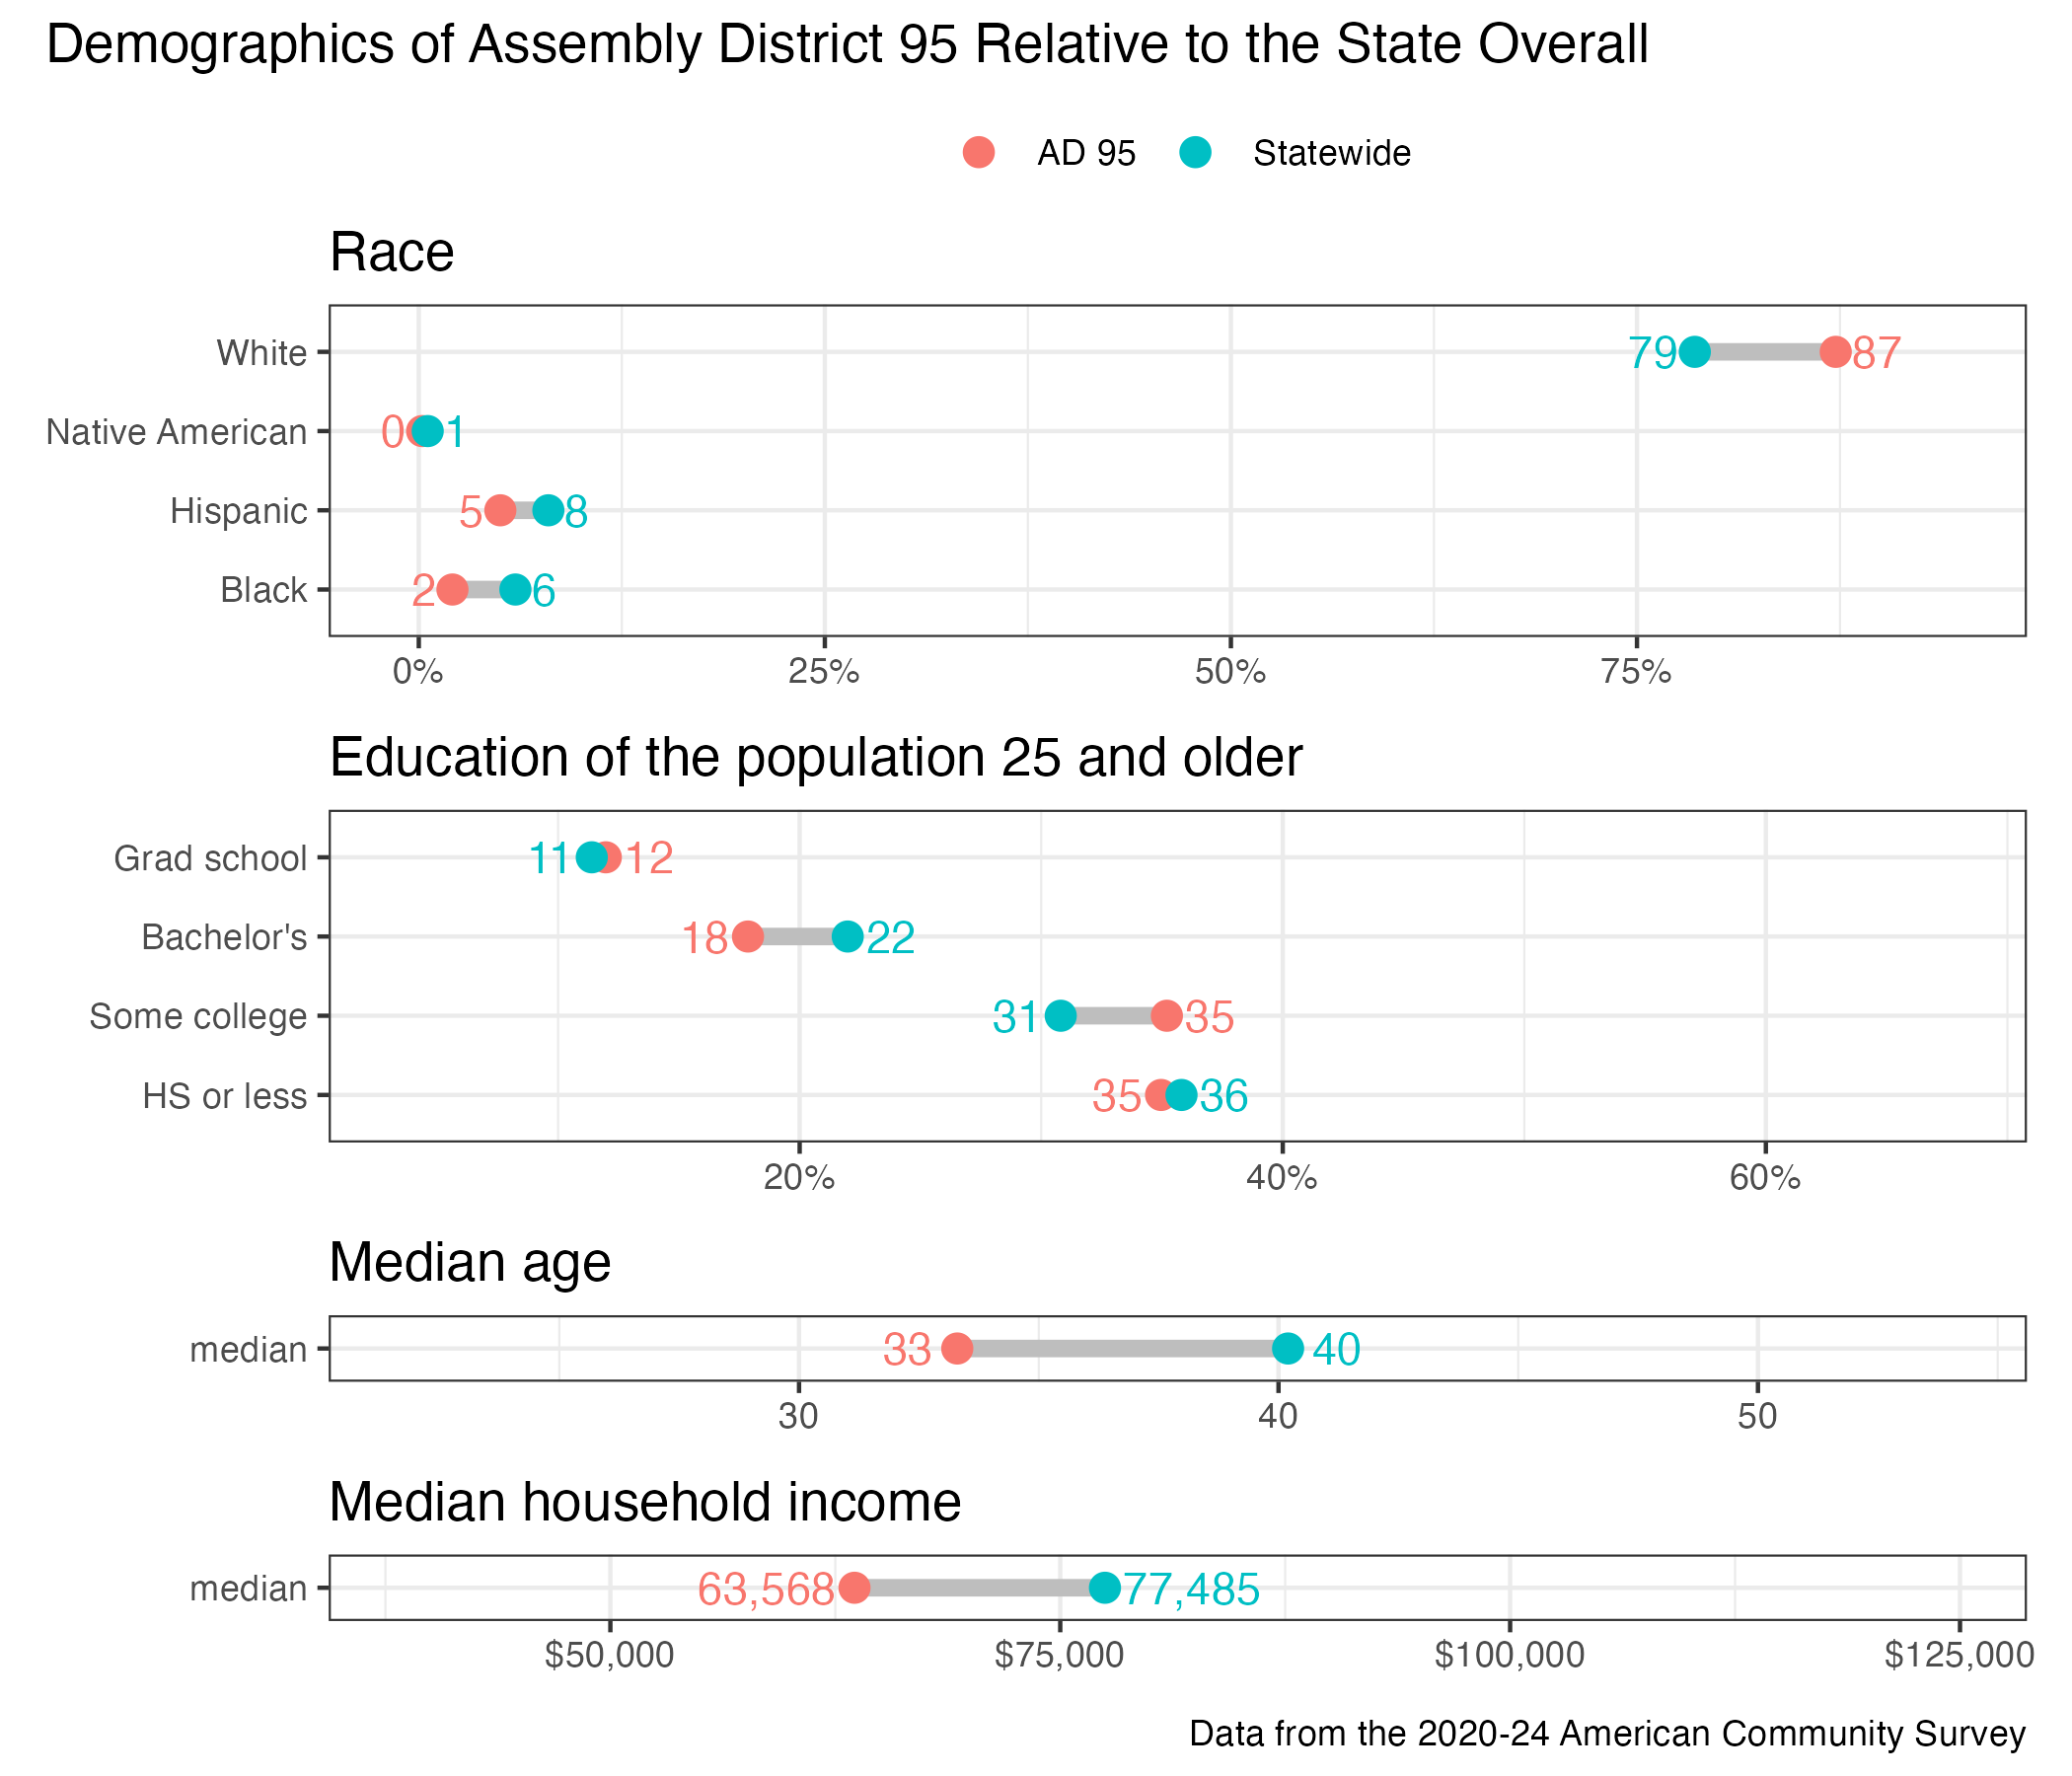
95th Assembly District
District
Candidates
| Assembly District 95 Candidates on the Primary Ballot | ||
| Incumbent: Jill Billings | ||
Jan 1 thru July 30
|
||
|---|---|---|
| receipts | disbursements | |
| Independent | ||
| Paul Michael Weber | NA | NA |
| Republican | ||
| Cedric Schnitzler | $0.00 | $0.00 |
| Democratic | ||
| Jill Billings | $19,879.54 | $3,109.81 |
| Data from the 2026 July Continuing Report. Any amended reports might not yet be shown. | ||
Past election results
| Election Results in Wisconsin State Assembly District 95 | ||||||
votes
|
Dem. %1 |
margin (Dem. - Rep.)
|
||||
|---|---|---|---|---|---|---|
| total | Dem. | Rep. | votes | points2 | ||
| 2016 President | 30,041 | 14,874 | 12,688 | 54.0% | +2,186 | +7.9 |
| 2016 Senator | 29,419 | 15,019 | 13,254 | 53.1% | +1,765 | +6.2 |
| 2018 Governor | 26,223 | 14,709 | 10,822 | 57.6% | +3,887 | +15.2 |
| 2018 Senator | 26,103 | 16,276 | 9,819 | 62.4% | +6,457 | +24.7 |
| 2020 President | 30,240 | 16,097 | 13,543 | 54.3% | +2,554 | +8.6 |
| 2022 Governor | 24,888 | 13,891 | 10,670 | 56.6% | +3,221 | +13.1 |
| 2022 Senator | 24,895 | 13,372 | 11,469 | 53.8% | +1,903 | +7.7 |
| 2024 President | 32,720 | 16,489 | 15,775 | 51.1% | +714 | +2.2 |
| 2024 Senator | 32,334 | 16,666 | 14,874 | 52.8% | +1,792 | +5.7 |
| 2024 WI Assembly | 31,660 | 16,461 | 15,191 | 52.0% | +1,270 | +4.0 |
| 2025 WI Sup. Ct.3 | 21,339 | 12,978 | 8,360 | 60.8% | +4,618 | +21.6 |
| 1 Share of the two-party vote. For Rep. share, subtract from 100. | ||||||
| 2 Dem % of the two-party vote minus Rep % of the two-party vote | ||||||
| 3 Formally nonpartisan candidates assigned party labels based on state endorsements | ||||||
| Election results allocated into 2024 district boundaries based on population overlap. Calculations by John Johnson (johndjohnson.info). | ||||||
District demographics