27th Assembly District
District
Candidates
| Assembly District 27 Candidates on the Primary Ballot | ||
| Incumbent: Lindee Rae Brill | ||
Jan 1 thru July 30
|
||
|---|---|---|
| receipts | disbursements | |
| Republican | ||
| Lindee Brill | $5,816.38 | $558.80 |
| Data from the 2026 July Continuing Report. Any amended reports might not yet be shown. | ||
Past election results
| Election Results in Wisconsin State Assembly District 27 | ||||||
votes
|
Dem. %1 |
margin (Dem. - Rep.)
|
||||
|---|---|---|---|---|---|---|
| total | Dem. | Rep. | votes | points2 | ||
| 2016 President | 33,750 | 10,898 | 20,593 | 34.6% | −9,695 | −30.8 |
| 2016 Senator | 33,630 | 10,495 | 22,159 | 32.1% | −11,664 | −35.7 |
| 2018 Governor | 30,751 | 10,067 | 20,250 | 33.2% | −10,183 | −33.6 |
| 2018 Senator | 30,562 | 12,115 | 18,413 | 39.7% | −6,298 | −20.6 |
| 2020 President | 37,538 | 12,952 | 23,953 | 35.1% | −11,001 | −29.8 |
| 2022 Governor | 31,573 | 10,999 | 20,242 | 35.2% | −9,243 | −29.6 |
| 2022 Senator | 31,482 | 10,377 | 21,059 | 33.0% | −10,682 | −34.0 |
| 2024 President | 38,738 | 13,283 | 24,896 | 34.8% | −11,613 | −30.4 |
| 2024 Senator | 38,450 | 13,261 | 24,358 | 35.3% | −11,097 | −29.5 |
| 2024 WI Assembly | 37,657 | 12,139 | 25,477 | 32.3% | −13,338 | −35.5 |
| 2025 WI Sup. Ct.3 | 26,925 | 10,343 | 16,568 | 38.4% | −6,225 | −23.1 |
| 1 Share of the two-party vote. For Rep. share, subtract from 100. | ||||||
| 2 Dem % of the two-party vote minus Rep % of the two-party vote | ||||||
| 3 Formally nonpartisan candidates assigned party labels based on state endorsements | ||||||
| Election results allocated into 2024 district boundaries based on population overlap. Calculations by John Johnson (johndjohnson.info). | ||||||
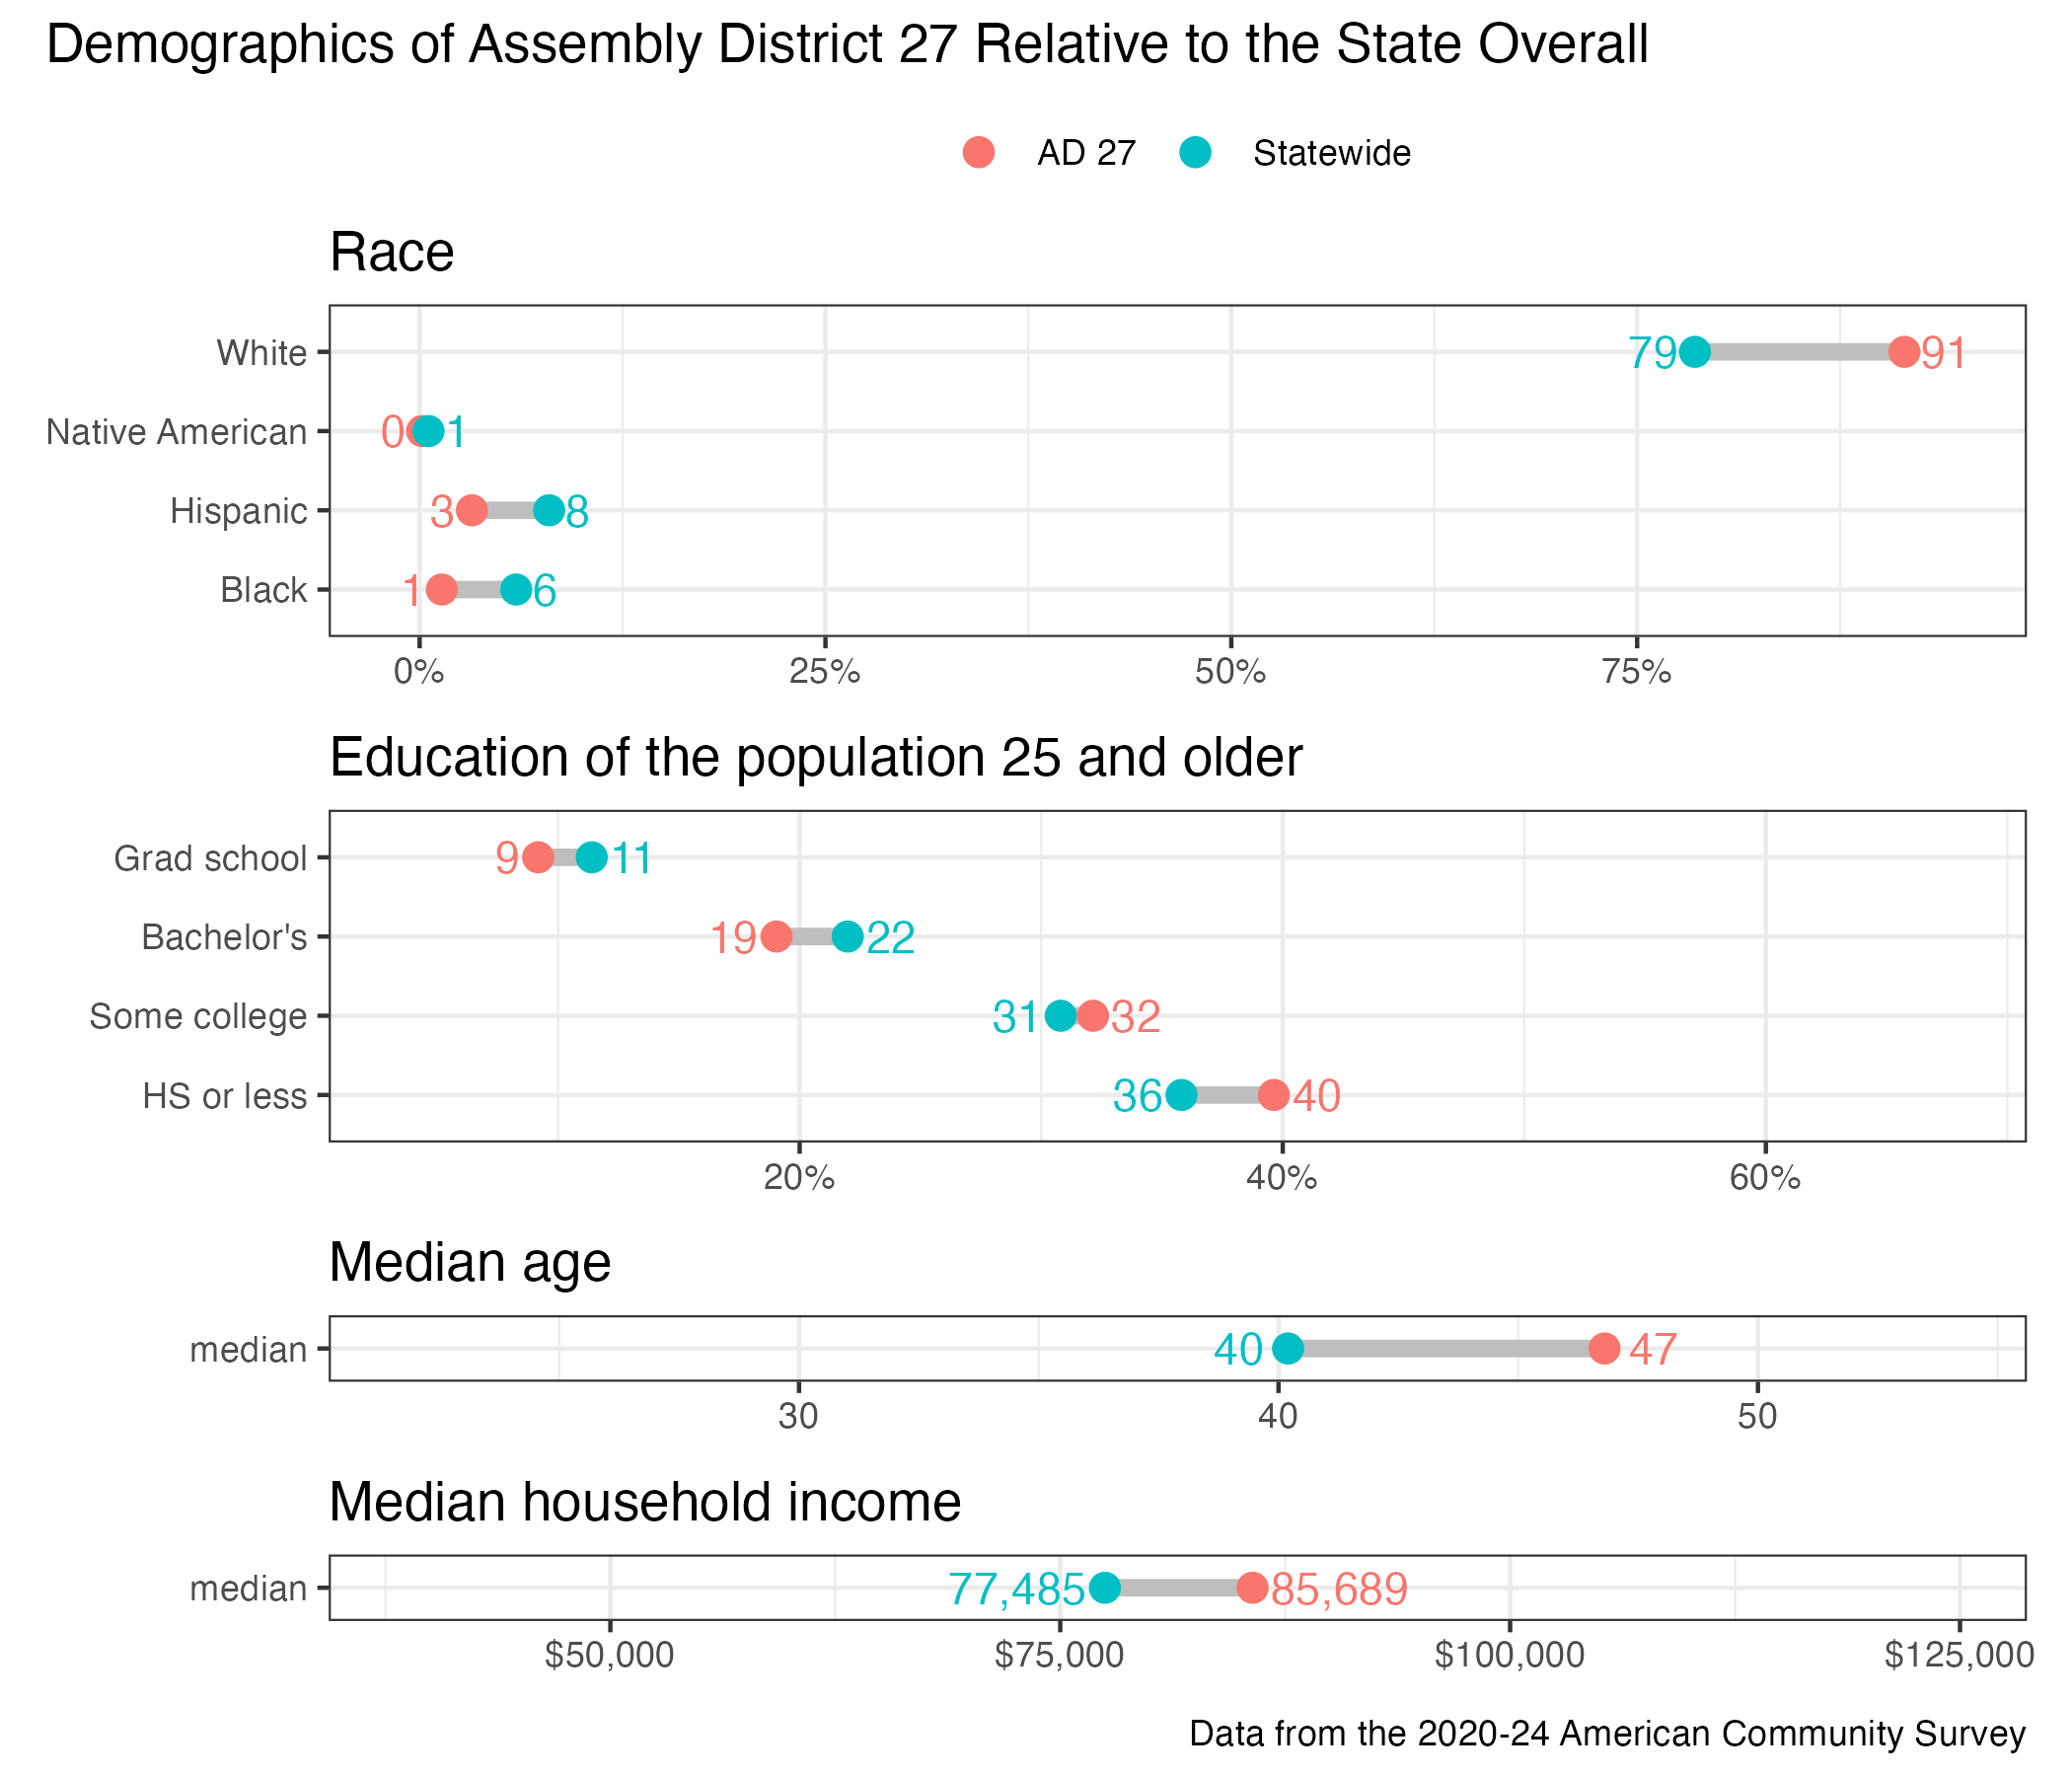
District demographics