25th Senate District
District
Candidates
| Senate District 25 Candidates on the Primary Ballot | ||
| Incumbent: Romaine Robert Quinn (Filed Notification of Noncandidacy) | ||
Jan 1 thru July 30
|
||
|---|---|---|
| receipts | disbursements | |
| Republican | ||
| Angie Sapik | $117,399.36 | $44,437.42 |
| Erik Severson | $39,478.00 | $29,886.82 |
| Democratic | ||
| Charly Ray | $119,004.79 | $30,682.26 |
| Data from the 2026 July Continuing Report. Any amended reports might not yet be shown. | ||
Past election results
| Election Results in Wisconsin State Senate District 25 | ||||||
votes
|
Dem. %1 |
margin (Dem. - Rep.)
|
||||
|---|---|---|---|---|---|---|
| total | Dem. | Rep. | votes | points2 | ||
| 2016 President | 93,506 | 39,110 | 49,010 | 44.4% | −9,900 | −11.2 |
| 2016 Senator | 91,738 | 41,120 | 47,684 | 46.3% | −6,564 | −7.4 |
| 2018 Governor | 79,872 | 38,469 | 39,611 | 49.3% | −1,142 | −1.5 |
| 2018 Senator | 79,383 | 42,362 | 36,997 | 53.4% | +5,365 | +6.8 |
| 2020 President | 105,724 | 47,003 | 57,135 | 45.1% | −10,132 | −9.7 |
| 2022 Governor | 83,707 | 38,748 | 43,910 | 46.9% | −5,162 | −6.2 |
| 2022 Senator | 83,751 | 37,370 | 46,312 | 44.7% | −8,942 | −10.7 |
| 2024 President | 110,663 | 46,977 | 62,028 | 43.1% | −15,051 | −13.8 |
| 2024 Senator | 109,510 | 47,644 | 59,214 | 44.6% | −11,570 | −10.8 |
| 2024 NA | NA | NA | NA | NA | NA | NA |
| 2025 WI Sup. Ct.3 | 75,448 | 36,493 | 38,925 | 48.4% | −2,432 | −3.2 |
| 1 Share of the two-party vote. For Rep. share, subtract from 100. | ||||||
| 2 Dem % of the two-party vote minus Rep % of the two-party vote | ||||||
| 3 Formally nonpartisan candidates assigned party labels based on state endorsements | ||||||
| Election results allocated into 2024 district boundaries based on population overlap. Calculations by John Johnson (johndjohnson.info). | ||||||
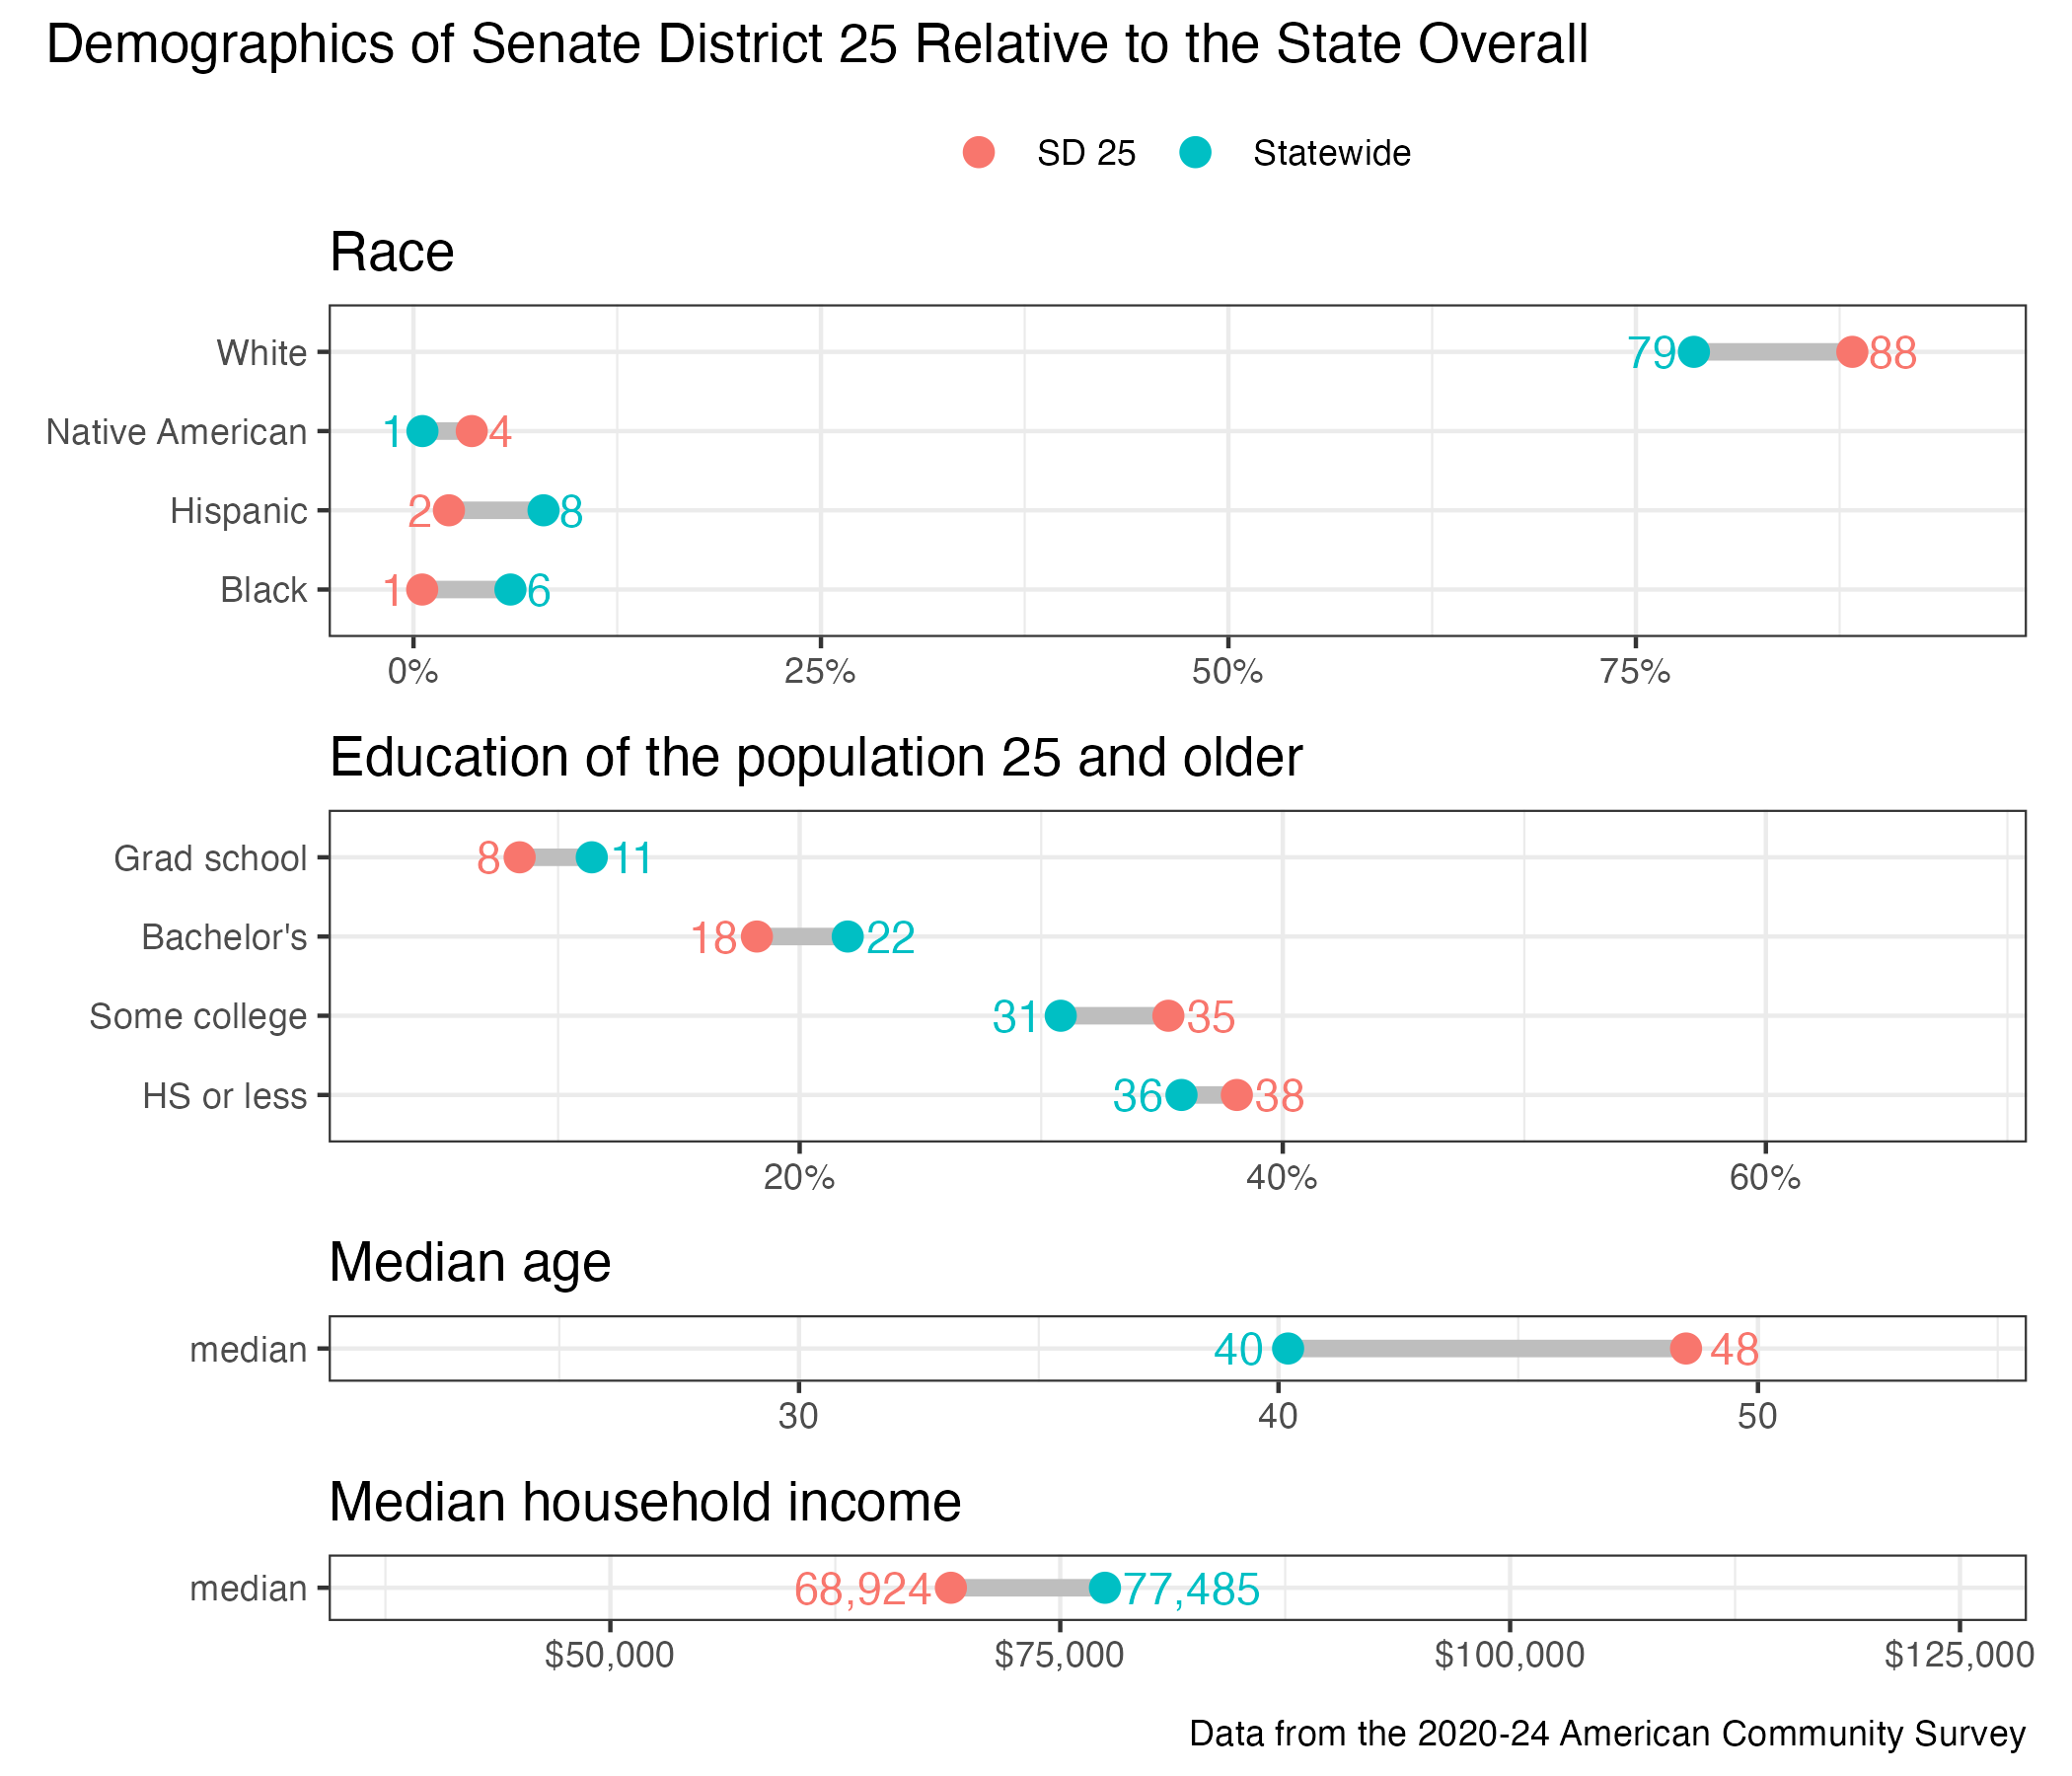
District demographics